Gantt Chart vs Timeline: Which Tool Will Turn Your Project to Win?
November 4, 2025 / Estimated reading time: 10 minutes

Audio version:
If a Gantt diagram and a timeline are the same things to you, then you are in the right place.
The battle “Gantt chart vs. timeline” will not reveal the unconditional winner. Still, it will show essential differences between these tools and clarify controversial points about what seems better for planning your work.
When we analyzed “Gantt chart vs. Kanban”, “Gantt chart vs. roadmap”, and “Gantt chart vs. WBS”, many apparent factors were compared. In the case of comparing a diagram and a timeline, the differences seem much hazier. However, they do exist, and it is essential for everyone involved in project management to understand and distinguish both tools.
Let’s figure them out, starting with the Gantt chart and timeline definitions.
Contents:
- What is a Gantt chart?
- Gantt chart examples.
- Gantt chart tools.
- What is a timeline?
- Timeline examples.
- Timeline tools.
- Gantt chart vs. timeline: critical factors for their differentiation.
What is a Gantt chart?
A Gantt chart is a graphical representation of project’s progress over time. This robust management tool offers a bird’s-eye view of the entire project, providing a clear overview of:
- The whole project schedule.
- Time estimates.
- Assigned team members.
- Task dependencies.
- Task priorities.
- Key project milestones.
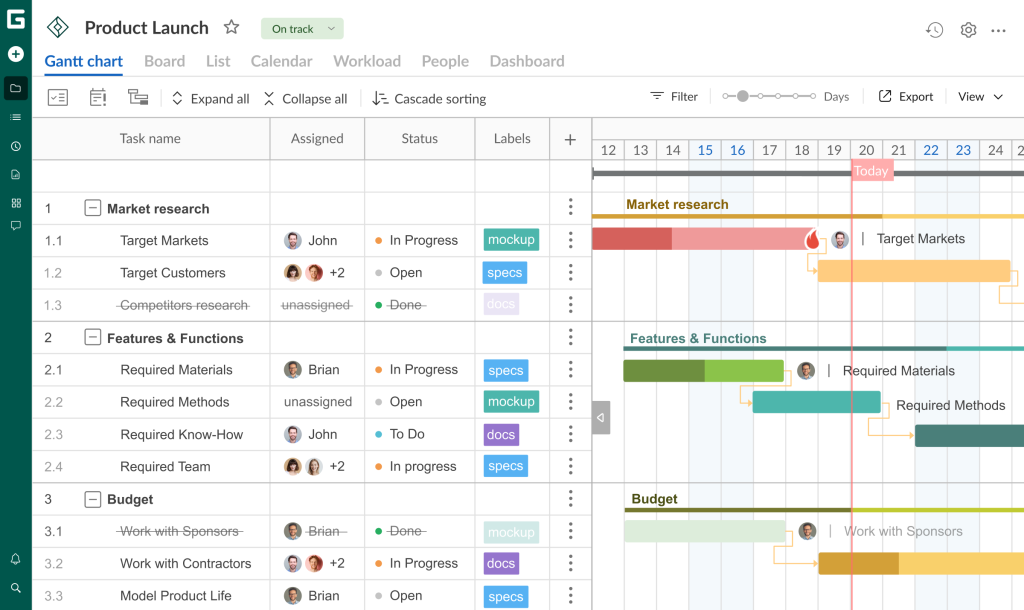
The diagram displays a timeline across two axes: the horizontal axis visualizes the schedule, and the vertical axis showcases all tasks and subtasks. Each task is shown as a colored bar.
Here’s how a typical Gantt chart looks like:
What is the primary purpose of this chart?
Projects are always time-sensitive. They include dozens of activities. Therefore it is crucial to understand if everything was planned as it should be and runs as it was intended.
People who apply a Gantt diagram can change the progress of tasks to track that everything runs on schedule. If not, they can easily find bottlenecks.
If they apply appropriate project planning software, it’s pretty easy to create and manage these charts. Besides, the additional functionality of such software can help to bring the managing process to an entirely new level.
Before exploring such a tool, let’s analyze an example of a typical Gantt chart applied to a real-life project.
Gantt chart examples
What is a Gantt chart in different spheres and industries?
The invention of Henry Gantt is widely applied in various professional areas.
Let’s have a look at a Gantt chart example from the event planning industry:
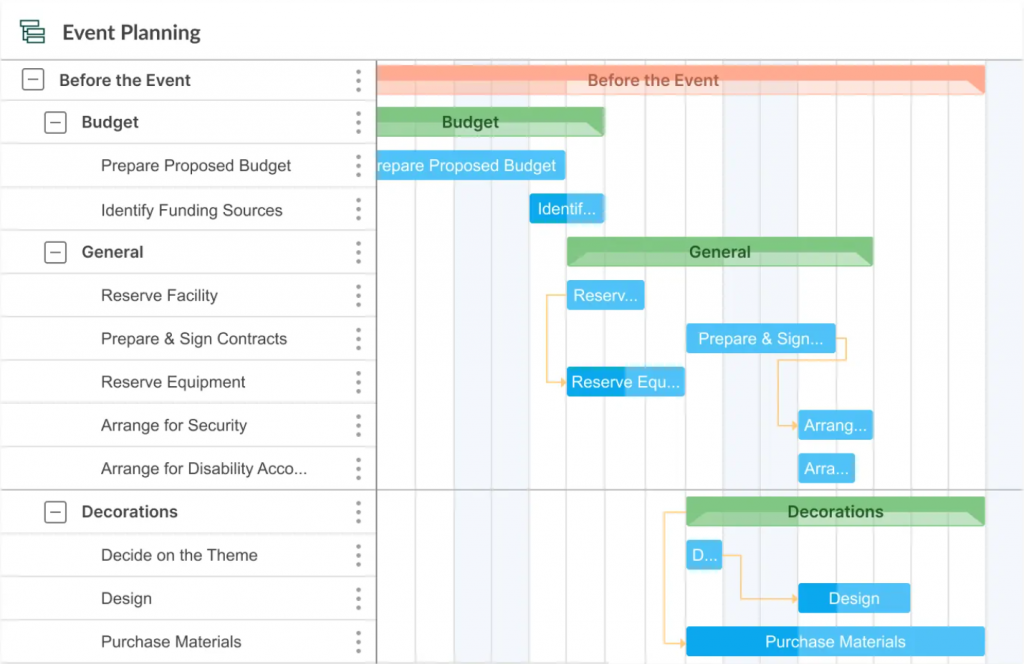
With the help of the diagram, you can plan and manage everything that happens before the event, on the day of this event, and after it.
Everything will be considered, from budgets to decorations and catering. You will be able to control each step. Looks incredible, right?
Besides event planning, you can use a Gantt chart for:
- Software development.
- Business planning.
- Construction.
- Marketing.
- Healthcare.
- Education.
- Retail.
- Consulting, and many more.
If you have no idea how to apply a diagram to your specific area, try to find an appropriate Gantt chart template that many project planning platforms offer.
If we come close to discussing the possibilities of modern Gantt chart-based planning tools, then it is vital to consider a specific example.
Gantt chart tools
47% stated projects were mostly or always run by professional project managers (Wellingtone, The State of Project Management 2021 Annual Report). And one of the most demanded features they used was a Gantt chart.
You can rightly note that it is possible to build a Gantt diagram using a pencil and a piece of paper. However, a professional environment requires the implementation of reliable software that is designed especially for this purpose.
A professional Gantt chart tool is used for:
- Creating and managing comprehensive projects. The diagram helps to visualize the building blocks of your project and organize them into manageable tasks.
- Defining logistics and task dependencies. The tool with the Gantt chart functionality assists in keeping an eye on the project logistics. Task dependencies ensure that a new task will start, for example, once another task is completed.
- Tracking project progress. The tool can demonstrate release dates, milestones, or other important metrics to monitor the progress of your project.
- Sharing your project with all stakeholders.
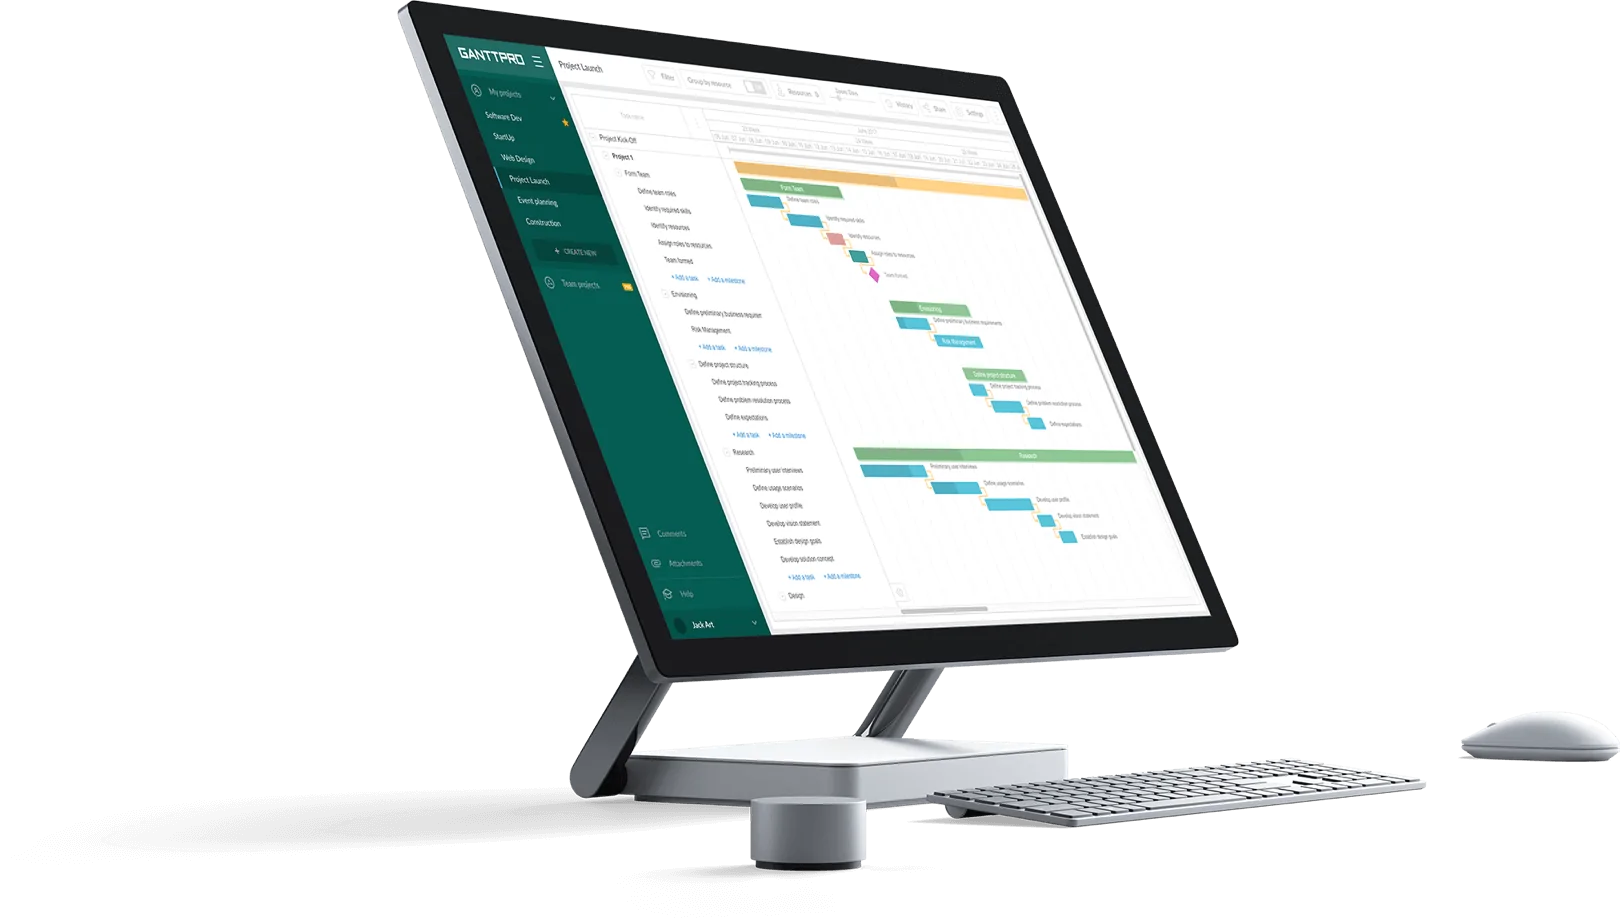
Suppose you are looking for the best platform that combines all the features and possibilities mentioned above. In that case, you should try GanttPRO — a multifunctional online Gantt chart tool admired by project management professionals around the globe.
The platform offers reliable features for planning, scheduling, and managing projects based on online Gantt charts. It can be applied in various businesses, from complex construction and IT projects to self-productivity.
GanttPRO empowers project teams to plan their work, manage resources, and improve team collaboration. It allows the creation of several workspaces and projects.
To learn more about this marvelous tool, check out its main features:
- Professional planning and scheduling based on a Gantt chart.
- Handy templates.
- Drag and drop functionality.
- Time tracking.
- File sharing.
- Risk management.
- Resource management.
- Budget management.
- Kanban board view.
- Notifications and deadlines.
- Reporting.
- Importing/exporting.
Not surprisingly, with such a set of professional features, GanttPRO is often used for building a digital Gantt chart timeline.
Gantt chart project planning tool
Create, manage, and share online timelines — all in one place.
Sign up for freeAll right, the “Gantt chart vs. timeline” discussion has a second part, just as important as the first one. Time to learn more about it.
What is a timeline?
A timeline is also a graphic visual explanation of a project. It graphically reflects when the project will start and when it will be completed before reaching the deadline.
Timelines can be considered as linear organizers that illustrate the passage of large blocks of time. They can take different forms and look different depending on their purposes. These are the most common types:
- Horizontal timeline.
- Vertical timeline.
- Roadmap.
- Chronological (historical) timeline.
- Gantt chart.
- Linear graph.
What is a timeline in the context of comparing it with a Gantt chart?
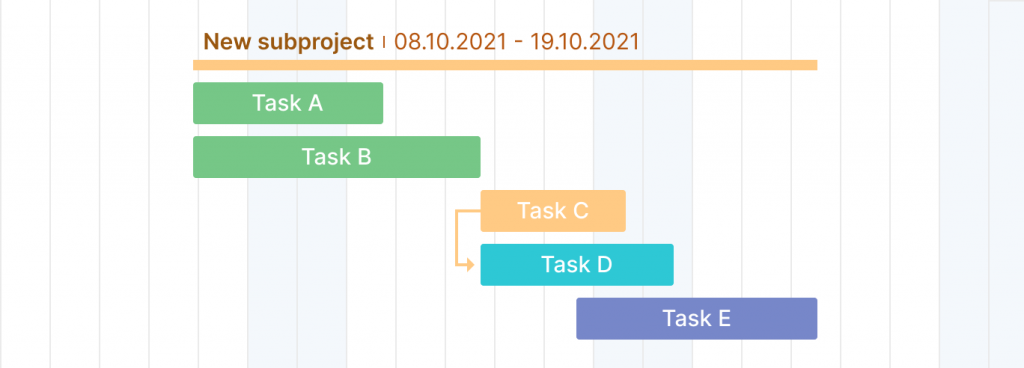
A timeline is slightly different from a Gantt chart. First of all, it usually does not contain horizontal and vertical columns. It simply demonstrates the way you need to follow.
So, a typical timeline contains events visualized on a single line, while a Gantt diagram includes a two-dimensional system with a sequence of tasks and their dependencies.
A timeline provides a high-level overview of a project’s start, end, and important milestones. A Gantt chart allows controlling project progress and delegating the responsibility for individual tasks.
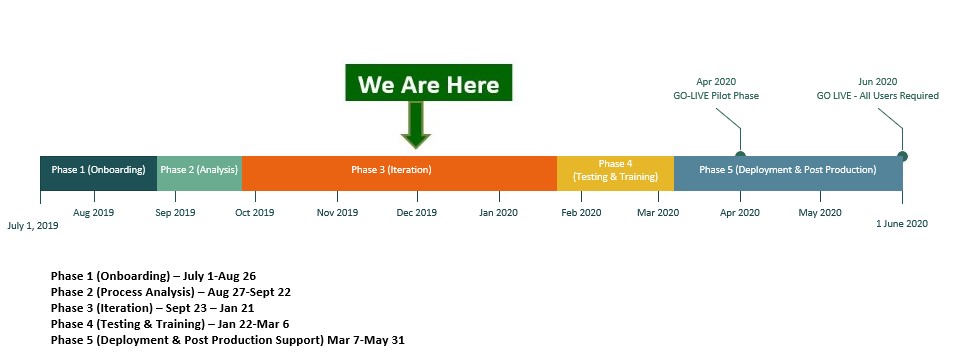
Here’s how a timeline may look like:
It is the most general visual representation of a timeline. To understand it in more detail, you need to consider some real-life examples.
Timeline examples
You may find different types of project timeline examples that can be used for various purposes. Project managers, business owners, or even students can look at these examples for references and apply them to their needs.
Here are some typical timeline examples:
- Project implementation plan.
- Daily schedule timeline.
- Marketing plan.
- Sales plan.
- Year overview timeline.
- Event planning timeline.
- Educational plan.
By the way, many colleges and universities teach how to work with timelines from scratch.
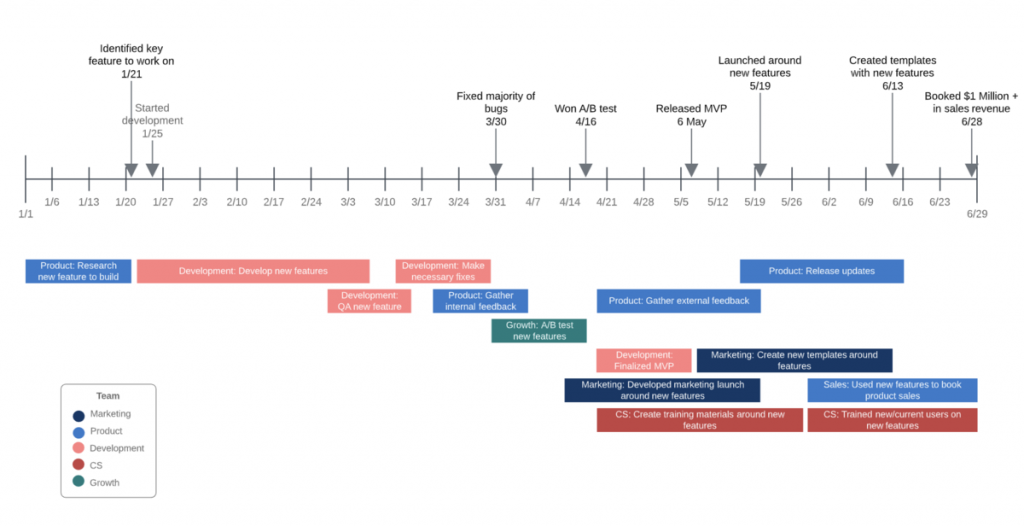
For example, the office of research administration of the University of Miami uses their own project timeline that they share with their students on their site. Here’s how they build it:
Now that we’ve covered a project timeline, you can ask a logical question: how to create a timeline?
Easy as pie! You can build one from scratch or start from a template that many timeline makers provide.
If drafting a timeline from start to end looks too time-consuming, a template option might be the better alternative.
All this brings us to the next topic — choosing an online platform for building a timeline.
Timeline makers
Online timelines are easy to create — you only need to have an appropriate timeline maker at hand.
Your purposes for making timelines may vary. Make sure you clearly understand what you need.
One of the popular software solutions for creating timelines with project management and planning features is Lucidchart. Its users can apply timelines in business and present ideas to coworkers in a consistent manner.
Creating timelines in Lucidchart is completely intuitive as it functions on a drag-and-drop basis. Besides timelines, this tool provides data visualization in:
- Flowcharts.
- Diagrams.
- Mind maps.
Among the most popular Lucidchart features, we define the following:
- Data visualization with timelines, flowcharts, diagrams, and mind maps.
- Database design.
- Drag & drop.
- Access controls/permissions.
- Alerts and notifications.
- Collaboration functionality.
- Data import and export.
- Third-party integrations.
- Business process mapping.
- Process documentation.
Well, we have explored both tools in detail. Now is the time to compare them face to face.
Gantt chart vs. timeline
Many people argue that a Gantt chart is a timeline and vice versa. And it can be true. It all depends on context and meaning.
A project timeline and a Gantt chart are used in very similar ways but are slightly different. They both describe the sequence of events that will take place in your project.
A timeline doesn’t include information about task dependencies, but it can show milestones of your project. It clearly distinguishes it from the Gantt chart, which provides such information.
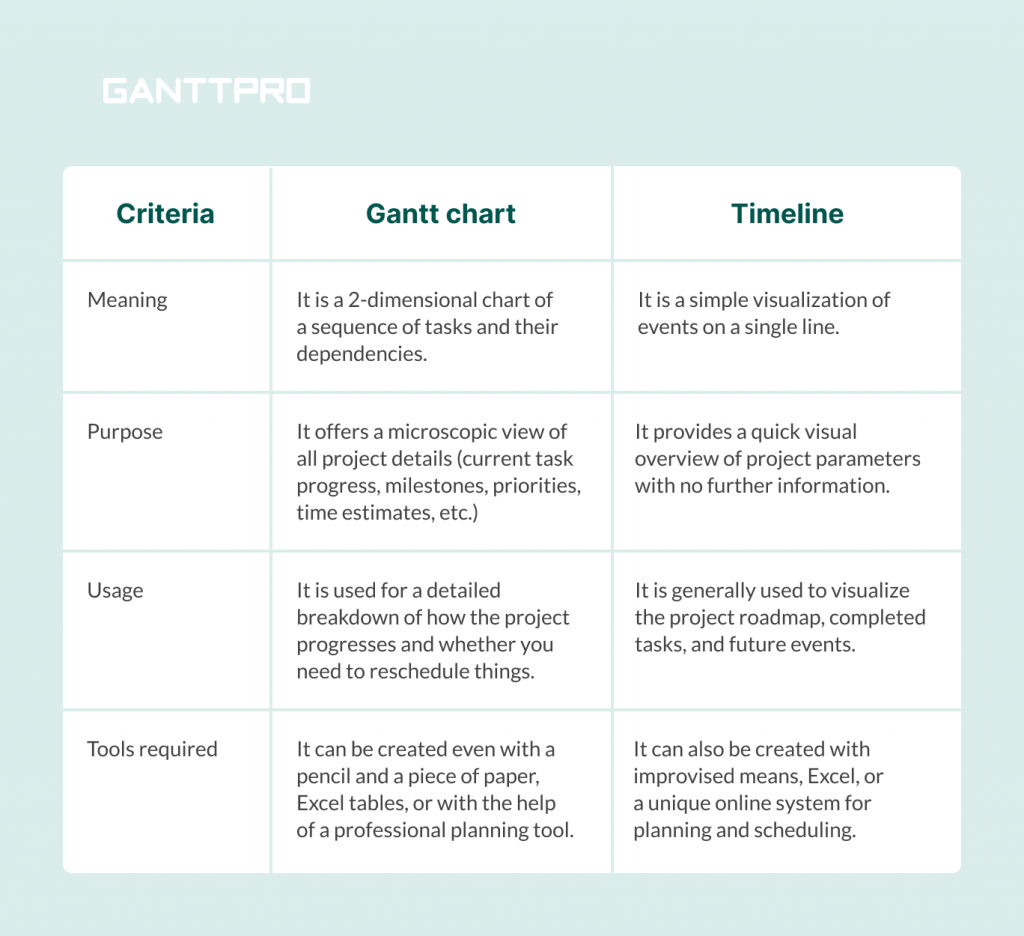
Study this table to understand the main differences between both tools.
When to use a Gantt chart
In general, a project plan based on a Gantt chart includes more information and it requires more work to prepare than a timeline.
Use a Gantt chart in the following cases:
- If you are aimed at visualizing a sequence of project tasks and their dependencies.
- If you need a microscopic view of all project details (current task progress, milestones, priorities, time estimates, etc.)
- If you need a detailed breakdown of how your project progresses and whether you need to reschedule things.
When to use a timeline
A timeline only provides an overview of the planned succession of activities and has no further information.
You may apply it in the following cases:
- If you need a more straightforward visualization of events on a single line.
- If you strive to visualize some basic project parameters like task name and their duration.
- If your goal is to visualize a project roadmap, completed tasks, and future project events.
Well, it seems that these were all the essential points that we wanted to share with you as a part of the “Gantt chart vs. timeline” comparison.
Define the best solution in the pair “Gantt chart vs. timeline”
A timeline vs. a Gantt chart is no more an unsolvable dilemma. The decision on which tool to use depends on what you strive to visualize with it.
A timeline would be enough if you only want to showcase a brief overview and your project is simple.
In case you desire to show specifically who is responsible for which task and what budget is allotted to every single step, a Gantt chart is a reliable tool for creating such a plan. It will also suit you to highlight which tasks depend on others to be completed first.
We hope now you have a clear understanding of the basics of both tools, their differences, and the best use cases.
Frequently asked questions about a Gantt chart vs. timeline
-
A timeline chart provides a high-level overview of events or milestones across a period. It focuses on sequential or chronological order without delving into task dependencies or detailed scheduling. In contrast, a Gantt chart is more structured. It is used for scheduling, and displaying tasks, their durations, dependencies, milestones, and progress. Timeline charts are often used for visual storytelling or presentations, while Gantt charts are tools for tracking and managing detailed project workflows.
-
Yes, a Gantt chart can serve as a timeline when you need more than just key milestones and want to include task durations and dependencies. It provides a detailed, visually rich timeline that reflects both the sequence and structure of tasks. It makes it particularly useful for complex projects where a standard timeline chart might oversimplify the relationships between activities.