Gantt Chart vs. WBS: Choosing From Two Reliable Ways to Plan Your Project
November 4, 2025 / Estimated reading time: 12 minutes

Audio version:
The world of project management contains many powerful tools, including various graphical diagrams and visual hierarchical structures.
“Gantt chart vs. WBS” is an important topic that should not be ignored, as it is critical to distinguish these tools, understand their purposes and scope of use.
Although these terms are sometimes used interchangeably, they are not synonyms and usually relate to different management tools.
It may seem that all the structures similar to a Gantt diagram have already been identified and investigated, as we’ve recently analyzed such important pairs as:
However, WBS (Work Breakdown Structure) is also worth adding to this list.
Let’s delve into details to figure it out.
Contents:
- What is a Gantt chart?
- Gantt chart examples.
- Gantt chart tools.
- What is a WBS?
- WBS examples.
- The difference between a WBS and a project plan.
- WBS tools.
- Gantt chart vs. WBS.
- How to convert a WBS to a Gantt chart?
- How to import WBS from Excel.
What is a Gantt chart?
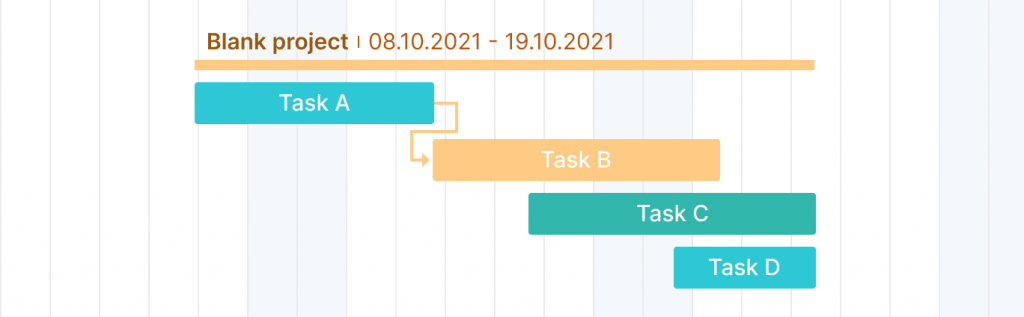
A Gantt chart is a bar chart that showcases a project’s progress, timeline, and dependencies – all in a highly visual and easily understandable view. This is one of the most widely used management tools for project scheduling and control.
The diagram was developed more than a hundred years ago by the American Henry Gantt.
It allows scheduling projects and their corresponding tasks while getting an overview of the entire project process.
Here are the core elements of a typical Gantt chart:
- A timeline – the backbone of the chart. It is more than a regular timeline where you can see how your project activities are progressing. A Gantt diagram allows users to zoom in and out of their timelines and add more valuable elements.
- A bar – a visual representation of a project or a task. It demonstrates the length of time and allows seeing who is engaged in that task.
- Resources – what makes your projects tick (people, equipment, and machines that bring projects to fruition).
- Dependencies – showcase how your tasks are linked together.
- Milestones – measure the project progress and show how it approaches the goals that have been set.
Besides, the diagram allows you to see time estimation for each activity, team members’ comments, activity overlaps, deadlines, and more.
Some people admit that a Gantt chart looks like a row of dominos. What do you think about it? 🙂
Gantt chart examples
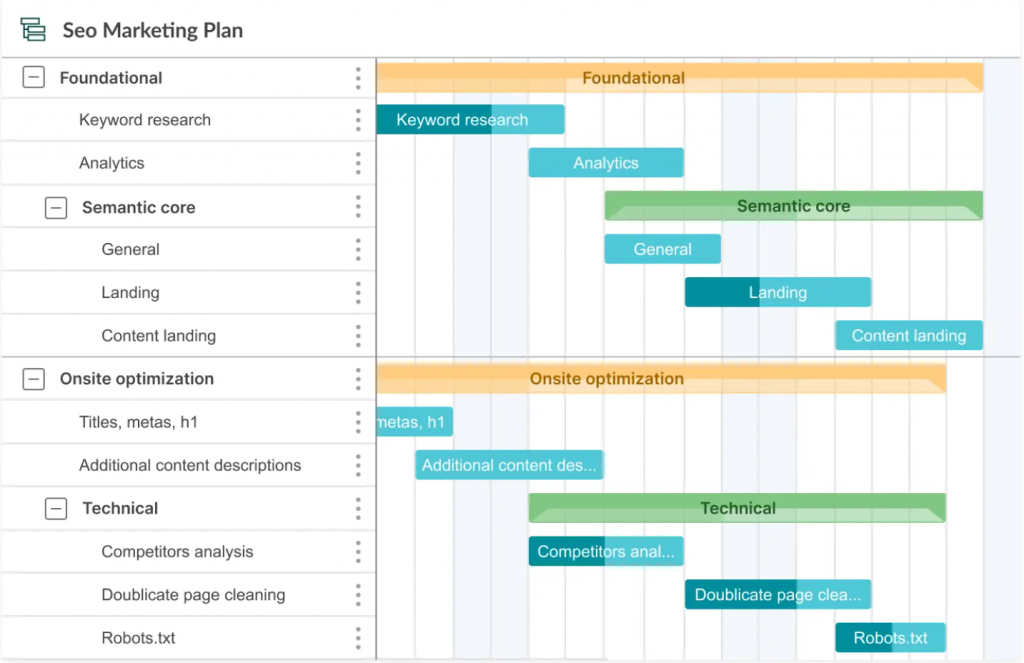
A bar diagram is commonly used to display a work plan, track the progress, and monitor task implementation. Looking for the real-life Gantt chart examples, you can find vivid cases from project management, construction, software development, marketing, event planning, business planning, and other spheres and sectors.
Here’s an example of how you can apply the diagram for creating a SEO marketing plan.
Any information is best learned in a specific case from real life and with examples of relevant tools that you can apply.
Gantt chart tools
With the help of a Gantt chart, you can see how your project’s tasks are progressing, what your resources are engaged in, and specific start and end dates. It makes it an ideal project management tool for the teams working on plans, stakeholders, or clients who need a rundown of progress.
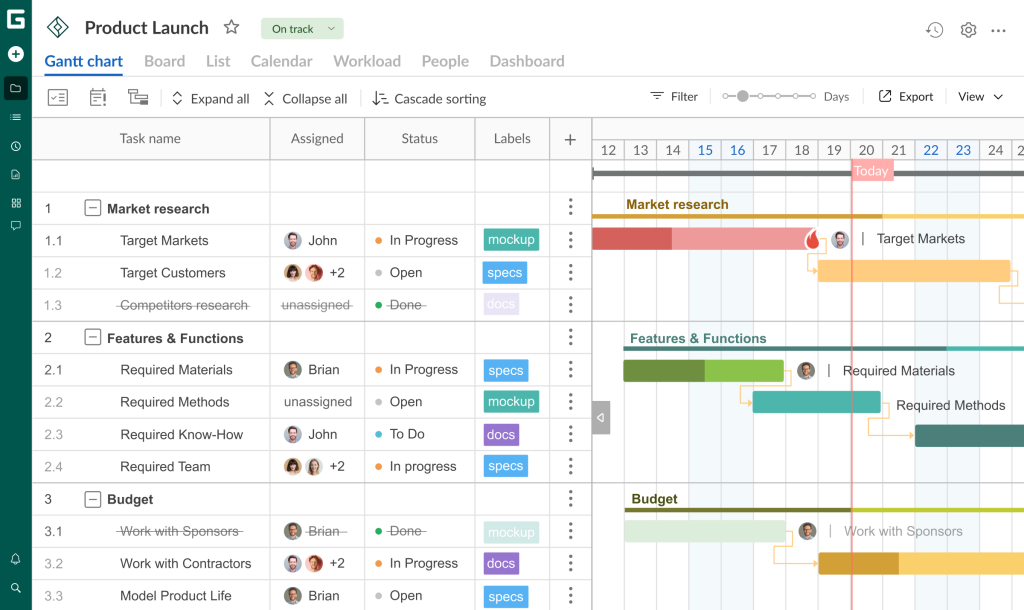
It’s simple to build a Gantt chart using some popular work tools, such as Excel. However, to take planning to a higher professional level, you should apply a robust and reliable system. And GanttPRO is one of the best solutions worth your attention.
GanntPRO allows building a powerful online Gantt diagram for different types of projects. You can use it to plan and manage single or multiple projects within minutes.
Just choose the option to create a project from scratch or select a free, ready-made template for your sphere. For example, for one of the top-3 industries that use PM tools: IT, financial services, and marketing (as for Capterra’s research of 2019).
This tool will quickly teach you how to read a Gantt chart as well as build and manage it without unnecessary headaches.
Here are some key features of the tool:
- Task planning and scheduling.
- Gantt chart templates.
- Drag and drop functionality.
- Deadlines and notifications.
- Delegating projects and tasks.
- Tasks prioritization.
- Time tracking.
- File sharing.
- Importing/exporting.
- Reporting, and many more.
This Gantt chart online maker will keep your planning simple, team members engaged, and customers in the loop.
Gantt chart project management software
Create a visual breakdown of hierarchical data using a Gantt diagram.
Sign up for freeAfter the detailed analysis of the famous histogram, it’s time to find out more details about its opponent in the “Gantt сhart vs WBS” pair.
What is a Work Breakdown Structure?
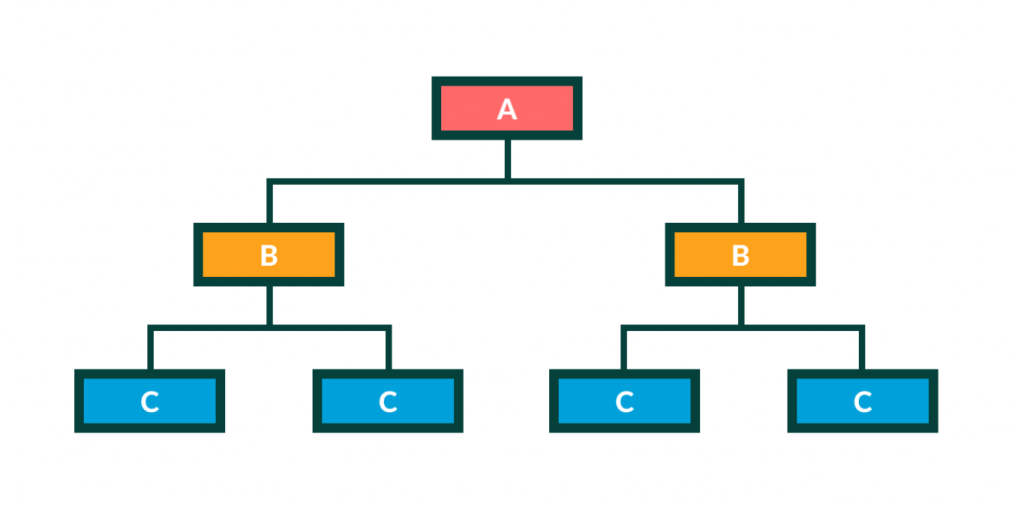
A WBS is a detailed tree structure of different tasks and deliverables that need to be done to complete a project.
Businesses that don’t value project management experience 70% more project failures. Therefore, good work organization looks like a “lifesaver” to many, and the WBS can really help.
What is a Work Breakdown Structure in project management?
This structure is the foundation of project planning alongside a Gantt diagram. These two approaches are probably the most common project management tools.
Project managers apply WBS to divide large projects to get things done faster and more efficiently.
Breaking them down into smaller chunks means work can be performed simultaneously by different team members. It leads to better team productivity and successful project management.
Why is WBS importnat in project management?
The preparation of WBS has the following practical advantages:
- Provides clarity about the tasks to be performed. It reduces complexity by dividing the entire project into smaller phases.
- Increases efficiency. WBS ensures that all necessary measures are taken and that a realistic time schedule can be carried out.
- Provides each project participant with an overview of the current status, from which they can deduce at what point their tasks are inserted.
- Enhances communication. The complete representation of the WBS can support communication as it boosts transparency and promotes effective discussions.
- Creates the basis for further planning. WBS is also the prerequisite for determining whether more detailed plans are needed. It reduces the risk of unplanned and unexpected costs.
Work Breakdown Structure examples
Your WBS can be different for each project. Sometimes it requires time to experiment and see which Work Breakdown Structure works best for your team.
The main idea is to show the hierarchy of your projects and make progress clear to everyone involved.
A Gantt chart can be considered one of the famous WBS examples. You can organize your Work Breakdown Structure as a Gantt diagram that links task dependencies and reflects project milestones.
Here are some more WBS examples:
- WBS spreadsheet (where you can also note different phases, tasks, or deliverables in columns and rows).
- WBS flowchart.
- WBS list.
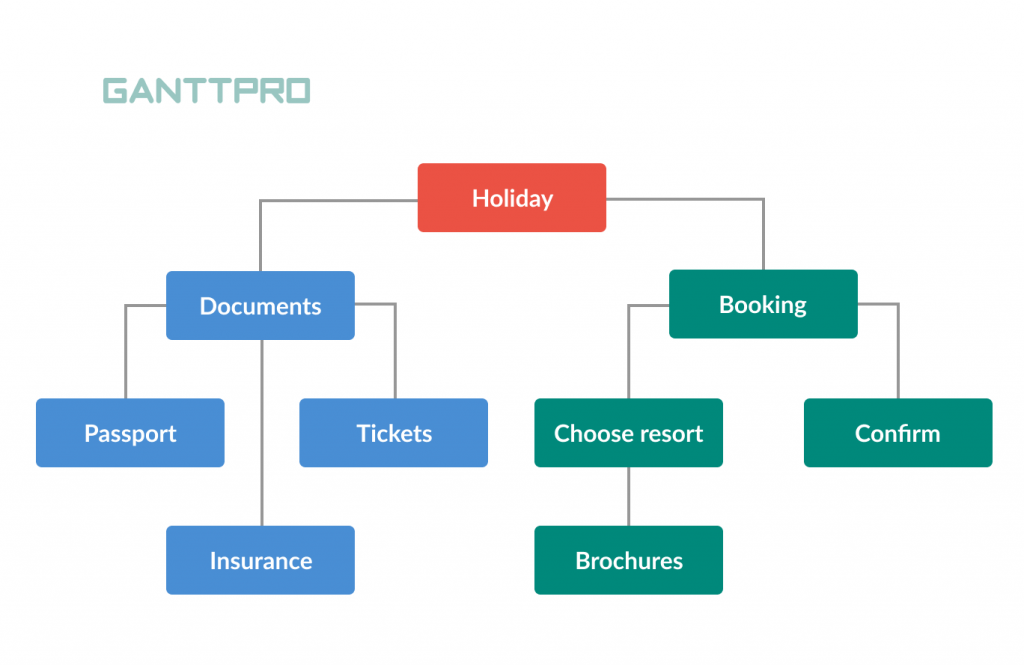
Using any Work Breakdown Structure example, you can organize and manage your events. For example, seasonal team-building activities or your holiday trip. Here’s how it may look like:
What is the difference between a WBS and a project plan?
A project plan and WBS are different management tools, and they usually don’t refer to the same concept. (Hopefully, you remember how to create a project plan with all the necessary details and nuances).
- WBS is at the core of project planning. Managers use it to divide the project into controllable elements. It gives them a hierarchical representation of all work required to complete their projects.
- A project plan establishes a general framework that guides all further planning. This document defines how the project will be managed and controlled.
Work Breakdown Structure tools
Creating WBS is a reliable way to get a project off the ground and ensure its efficient execution.
There are many Work Breakdown Structure software solutions out there. When you choose one, you get a simple way of outlining the project scope and project deliverables.
Creately is a well-designed diagramming and Work Breakdown Structure tool that looks perfect for visualizing whatever concept or idea you have. The platform offers visually appealing and presentation-worthy diagrams for various purposes.
This WBS tool is widely used by teams striving to visualize their ideas, concepts, plans, and processes. Business owners, project managers, designers, engineers, business analysts, educators, HR professionals, and many more can benefit from it.
Creately offers friendly settings and powerful features, including:
- Handy flowcharts, organizational charts, wireframes, UI diagrams, and other ways of visualization.
- A template library with 1000+ templates.
- Document management.
- Drag and drop for fast design.
- Team collaboration.
- Brainstorming functionality.
- Exporting in different formats.
- Feedback management.
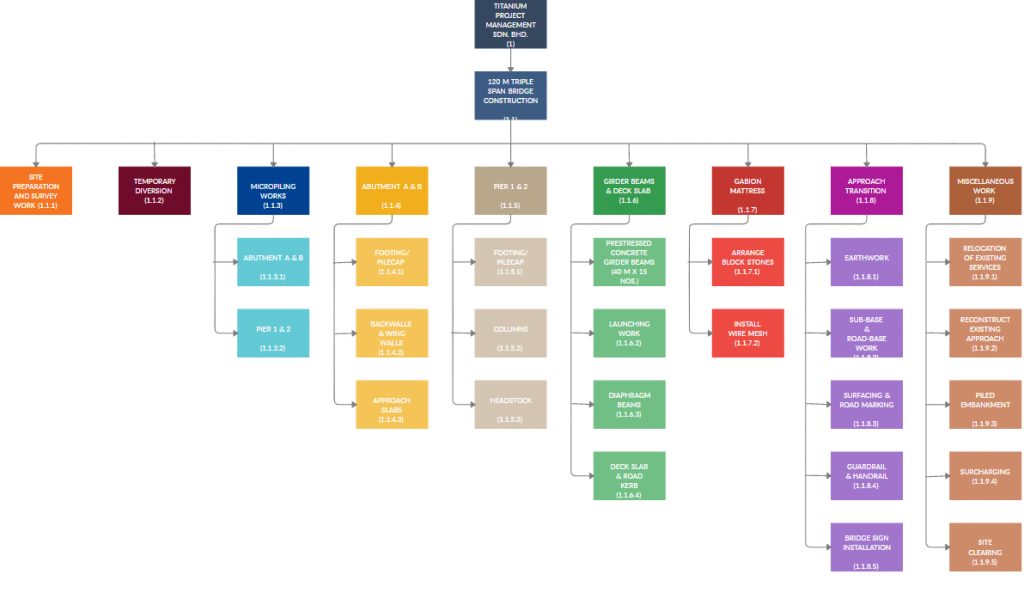
To get closer to the point, take a look at how a bridge construction project can be implemented with this online WBS tool.
We have analyzed both tools and now it’d be helpful to briefly highlight the main points of their differences.
Gantt chart vs. WBS
Project management professionals typically apply a WBS to show what they are doing and use a Gantt chart to visualize when they are doing it.
Let’s take a look at some more critical differences between the two structures.
When to use a Gantt chart
Handling project management with a Gantt chart ensures numerous benefits, including detailed scheduling, accurate task planning, improved efficiency, and increased accountability.
Here are some essential points to help you choose the diagram:
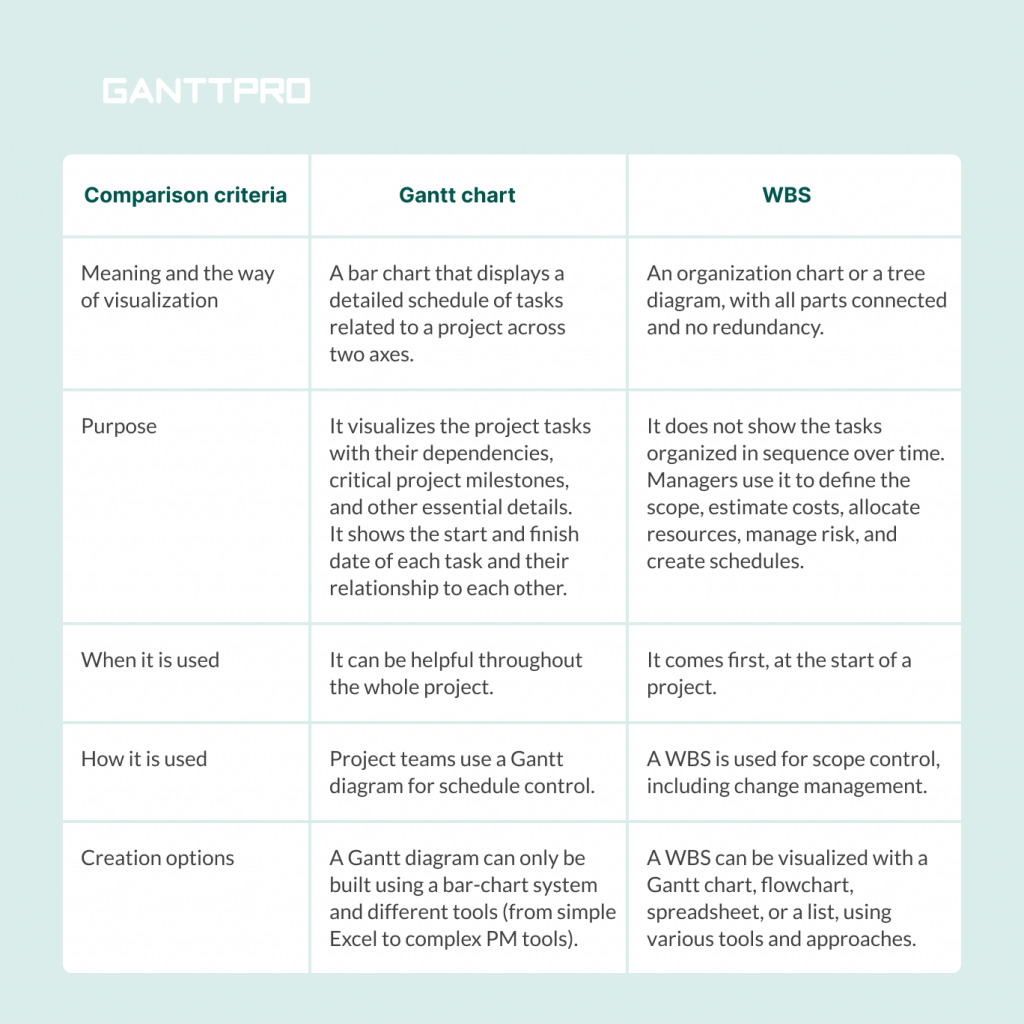
- It displays a detailed schedule of tasks related to a project across two axes.
- It visualizes the project tasks with their dependencies, critical project milestones, and other essential details. It shows the start and finish date of each task and their relationship to each other.
- It can be helpful throughout the whole project.
- It is commonly used for schedule control.
- You can build it using a bar-chart system with the help of different tools (from simple Excel to complex project management software solutions).
When to use a Work Breakdown Structure
A Work Breakdown Structure will assist you in any case when you need to break your project down into a hierarchy of deliverables and tasks.
Keep in mind the following characteristics of this method:
- It is an organization chart or a tree diagram, with all parts connected and no redundancy.
- It does not show the tasks organized in sequence over time. Managers use it to define the scope, estimate costs, allocate resources, manage risk, and create schedules.
- It looks super helpful at the start of a project (in comparison with the invention of Henry Gantt that can assist throughout the whole project).
- It is used for scope control, including change management.
- You can visualize it with a Gantt chart, flowchart, spreadsheet, or a list, using various tools and approaches.
How to convert a WBS to a Gantt chart?
By this part of the article, you should be sure that it is possible to convert a WBS to a Gantt chart without unnecessary headaches. But how to do it in practice?
Let’s recollect GanttPRO again as it can become your true helper in building a visually appealing Work Breakdown Structure.
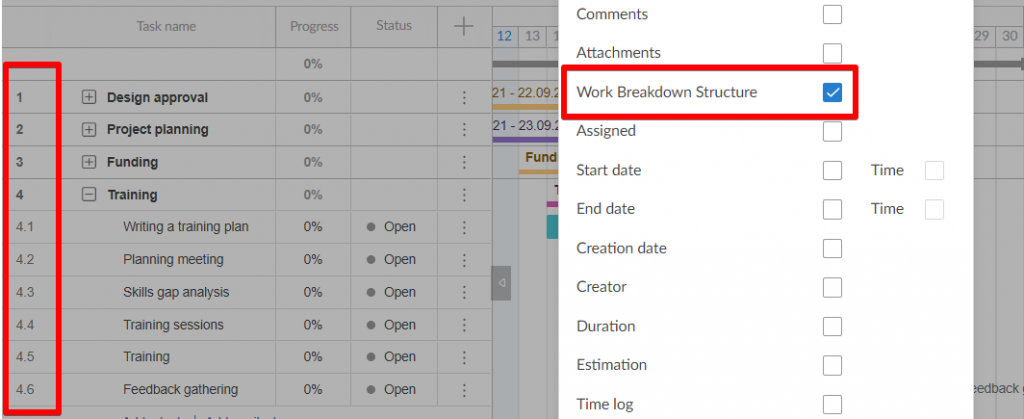
In this WBS creator, you can initiate and manage as many projects as you need with an unlimited number of tasks.
So, having your initial project, you can easily create a list of tasks and subtasks. By adding a custom WBS field from the list, you can easily order your task list to visualize the hierarchy you want.
Take a look at how effective it seems:
How to import WBS from Excel
As we’ve mentioned above, a WBS, like a Gantt diagram, can be built using plain tools. For example, you can create the WBS in Excel in a few minutes.
Moreover, you can easily transfer any project created in Microsoft Excel to GanttPRO and continue to work on project plans with your team and clients there.
How to transfer a WBS from Excel?
To import your project with the WBS numbering in Excel, press Import (when creating a new project), then drag & drop or upload it from your computer.
Do not forget to set the task number in your WBS so that GanttPRO can correctly determine the position of the tasks on the project.
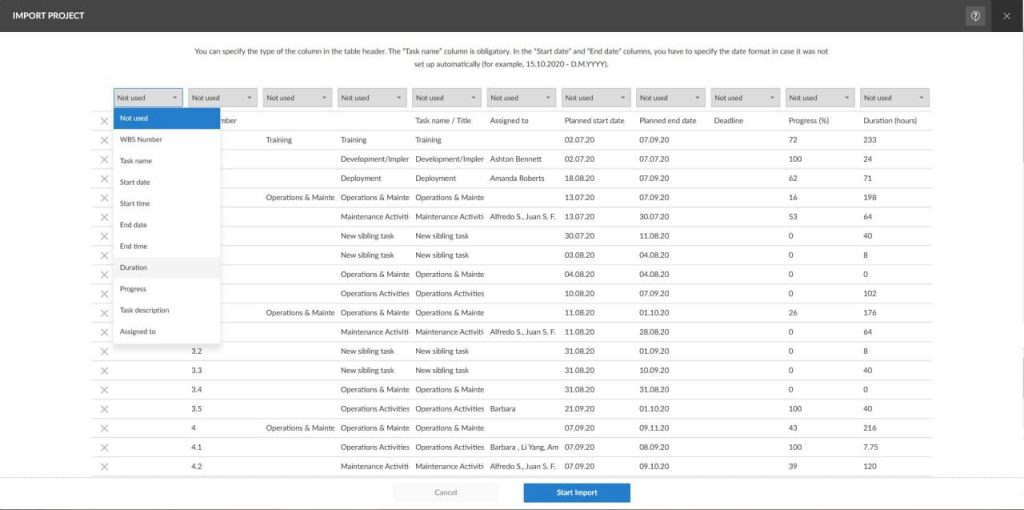
Follow the steps described above, and present Excel WBS numbering with GanttPRO like a real professional.
And if you want to get more details about importing projects from Excel to GanttPRO, follow this video:
Gantt chart vs. WBS: choose your favorite and plan efficiently
A Work Breakdown Structure and a Gantt diagram are the essential tools in project management. That’s why the battle “Gantt chart vs. WBS” looks actual and raises many questions.
The WBS can be considered the skeleton of your future project plan. It drives decisions concerning establishment of the project scope, task identification, and resource allocation. Therefore, modern PM tools contain the option to build a Gantt chart within the Work Breakdown Structure functionality.
Both concepts allow teams to be informed of the progress made. They boost team efficiency and lead individuals to successful decisions.
The only thing that remains is just to remind you that the topic “WBS vs. Gantt chart” will not be fully perceived without the practical use of robust PM software.
Get the most of the powerful diagram created by Henry Gantt and build a visually appealing Work Breakdown Structure!
Frequently asked questions about a Gantt chart vs. WBS
-
No, a work breakdown structure (WBS) is not the same as a Gantt chart. A WBS is a hierarchical tool that breaks a project into smaller, manageable components. It focuses on what needs to be done. A Gantt chart, on the other hand, is a visual timeline that schedules when tasks are executed and how they relate to one another. A WBS can be visualized with the help of a Gantt chart as well as other tools.
-
The primary difference lies in their purpose and presentation. A WBS is a tree-like structure that outlines the scope of work. It helps teams understand the deliverables and sub-tasks required. A Gantt chart is a timeline-based tool that schedules these tasks, showing start and end dates, durations, milestones, and dependencies. While a WBS organizes a project’s structure, a Gantt chart focuses on execution and time management.
Bonjour,
Est ce possible de mixer le GANTT avec le WBS?
Merci d’avance pour vos réponses
Cordialement,
DK