How to Create a Project Timeline in Excel: 3 Different Ways & Alternative Approach
Audio version:
Business success often depends on detailed planning, which can be visualized using a project timeline and trusted online tools like Microsoft Excel.
If you’re wondering how to create a project timeline in Excel, there are several ways to explore.
This article will guide you through these practical ways step by step with the video included at the end of it. You’ll also discover a more efficient approach to building a stunning timeline with one of the best Gantt chart-based tools.
Contents:
- How to create a project timeline in Excel using a stacked bar chart.
- How to create a project timeline in Excel using SmartArt.
- How to create a project timeline in Excel using templates.
- Common limitations of creating a project timeline in Excel.
- How to create a project timeline in GanttPRO.
How to create a project timeline in Excel
Managers often start using Excel for simple calculations and soon discover its capabilities for detailed planning. Such capabilities are beneficial because task planning is fundamental for teams in all industries, regardless of project size.
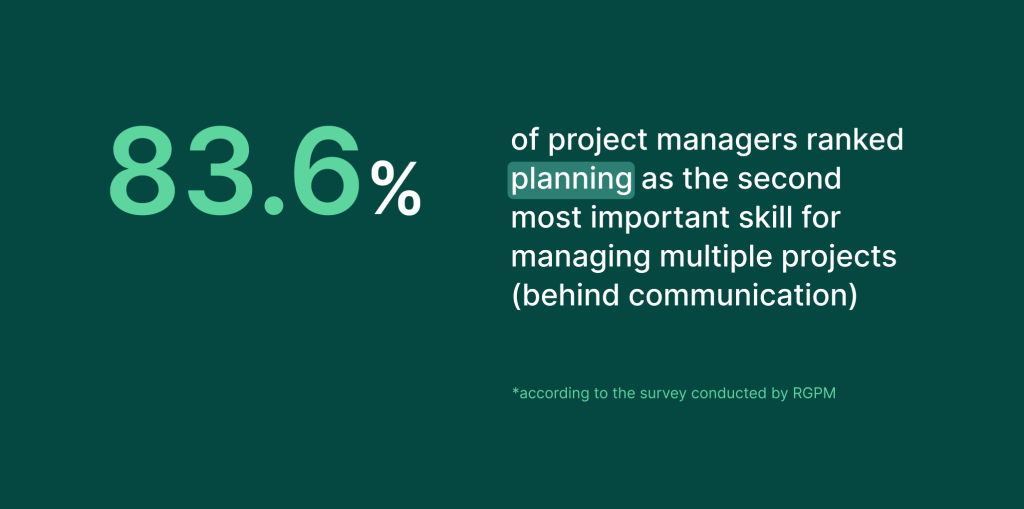
A survey confirms this, finding that planning is one of the most important skills for managing multiple projects.
Visual timelines for effective planning usually consist of essential components such as tasks, deadlines, dependencies, and other elements.
The Microsoft Office solution, along with many popular project timeline makers, provides basic features to help you generate such a timeline.
How to create a project timeline using this popular tool?
There are 3 common ways, each differing in complexity.
Before diving into these options, ensure you’ve gathered all the information required for your timeline.
Now, let’s dive into the project timeline examples built in Excel with different approaches.
Option 1: how to create a project timeline in Excel using a stacked bar chart
A project timeline in Excel can be created using a Gantt chart. Although this method demands significant time and meticulous effort due to its manual nature, it offers the advantage of complete control over the design and structure of your timeline.
Here is a detailed instruction to build a Gantt chart timeline in Excel using a stacked bar chart.
- Create a table with tasks and their duration.
- Add a Gantt chart with the help of a stacked bar.
- Select data for your timeline.
- Format your stacked bar chart.
- Change the order of tasks.
- Use additional features to improve your project timeline.
Incidentally, you may recognize these steps if you’ve ever explored how to create a Gantt chart in Excel.
1. Create a table with tasks and their duration
Start by creating a spreadsheet. It will serve as a basis for organizing all the essential information about your project.
List all required tasks, arranging them sequentially from start to finish, with each task occupying its own row.
Next, add columns to capture key details: one for a start day and another for an end day.
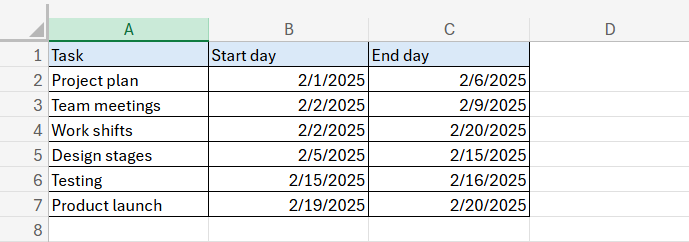
Also, add a column to calculate the duration of each task (the total time or number of days needed to complete it).
Go to the first row in the Duration column and input a formula to calculate the difference between the Start day and End day values.
To create the formula, type an equal sign (=). Next, click on the cell containing the End day, add a minus sign (-), and then click on the cell with the Start day.
The difference between these values will reflect the duration of each task measured in days.
In our example, we value D because our Duration column is D. Accordingly, your column may be different. 2 in the formula means the number of a required line with a task. You may have a different value.

Apply the same formula to the remaining cells in the Duration column.
After this step, you should get a table that indicates your tasks, their due dates, and duration.

Move on to create a Gantt chart to visualize your project timeline.
2. Add a Gantt chart with the help of a stacked bar
Now you can make your Excel Gantt chart.
Select all values in the Start day and Task columns, and find the Insert tab at the top left corner of your screen.
Click the chart icon and then pick up the Stacked Bar chart in the drop-down menu.
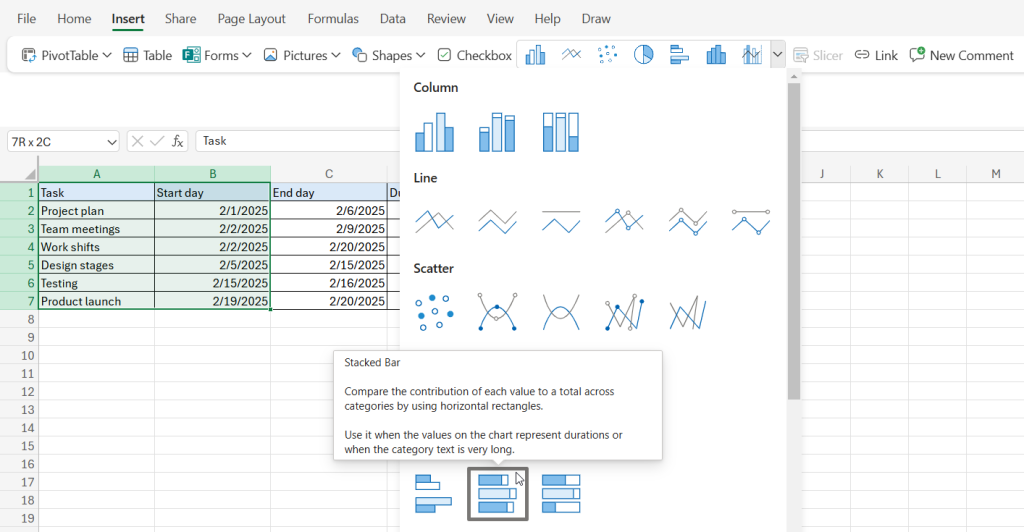
After completing the last step, you should get a stacked bar chart — the initial view of your timeline.
However, it’s still distant from the intended result.
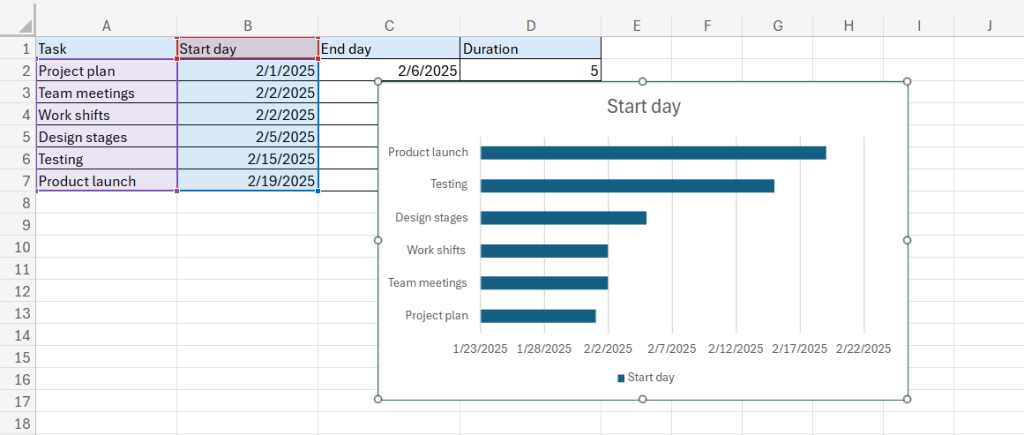
3. Select data for your timeline
It’s time to fill this chart with additional data to display your project timeline effectively.
Right-click on your stacked bar chart. Then choose Select Data from the dropdown menu. A new window will appear.
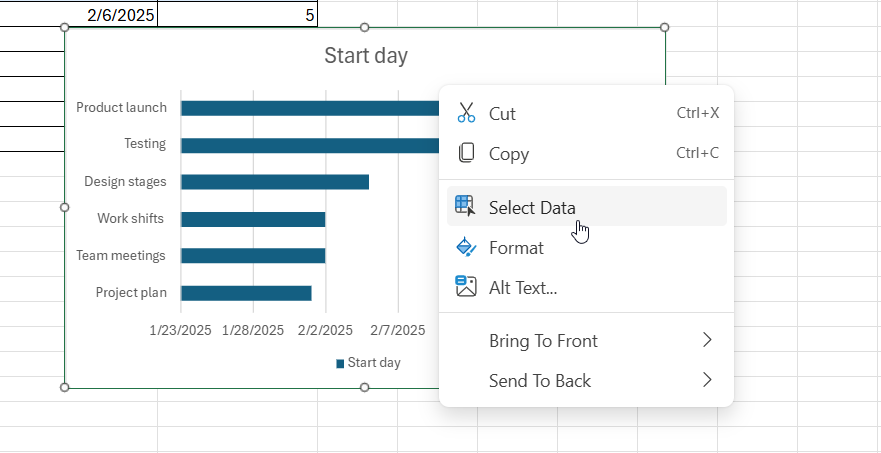
Choose the Data section to proceed.
Next, assign the header of the Duration column as the series name, and choose all numeric values in this column as the series values.
Click Submit to apply the changes.
In our example, the selected values will be in the range D2:D7.
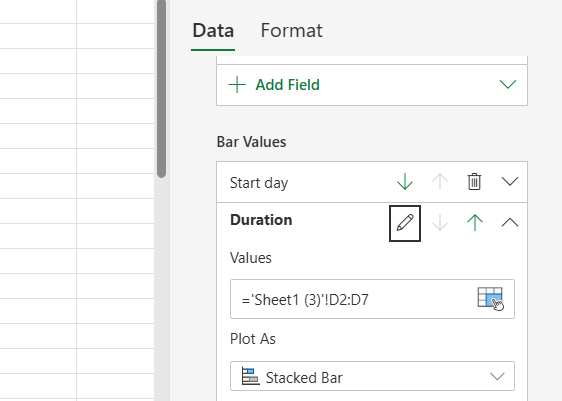
Now it only takes a few simple steps to achieve the look you want.
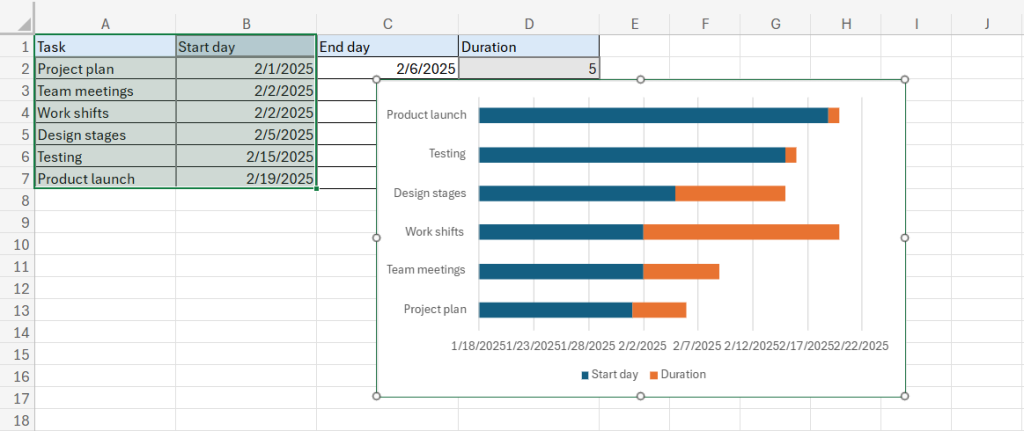
4. Format your stacked bar chart
Click twice on the chart image to open the Format pane. It will allow you to begin formatting your data.
The pane will appear on the right side of your screen. Choose the Start day series section and click on it.
You’ll see a paint bucket icon among the available options. Click on it and select No Fill from the dropdown menu.
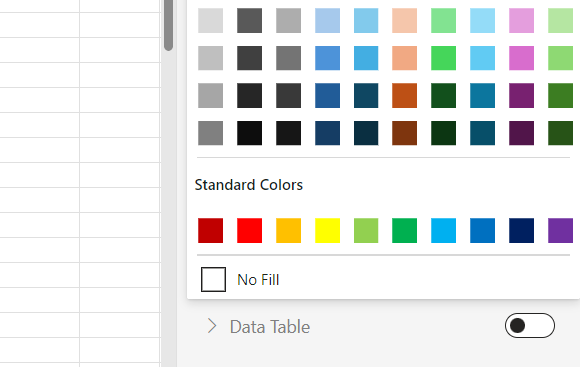
The blue bars will disappear.
Here is how it will look like.
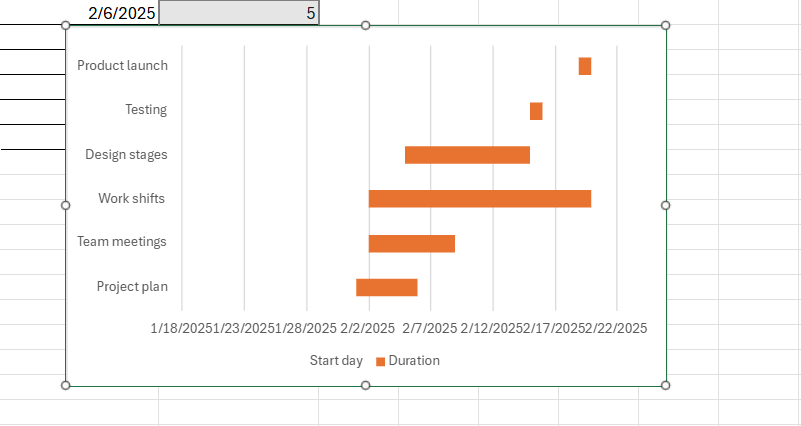
5. Change the order of tasks
The image above reflects your tasks in the wrong order.
To change this order and align the tasks, you need to go to the Format pane that is located on the right side of your screen and then find the vertical axis options.
Scroll down to find Categories in reverse order checkbox. Mark it.
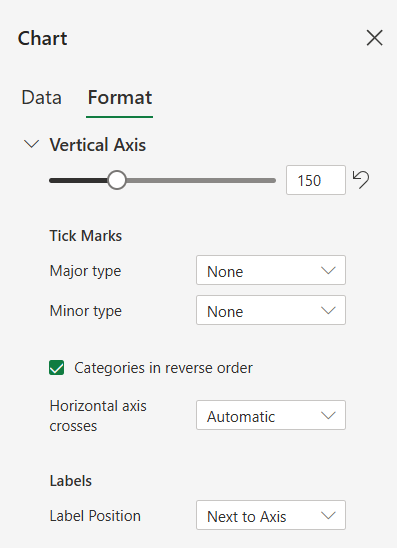
Now, your timeline looks better.
You have a choice to either keep the date line at the bottom or move it above the tasks by selecting the appropriate option in the same section of the pane.
You can also optimize a gap before the first task on the line and gaps between dates.
Click twice on the line with dates. You’ll see the horizontal axis menu in the Format pane.
Choose the Bounds section and try different values to find an appropriate option.
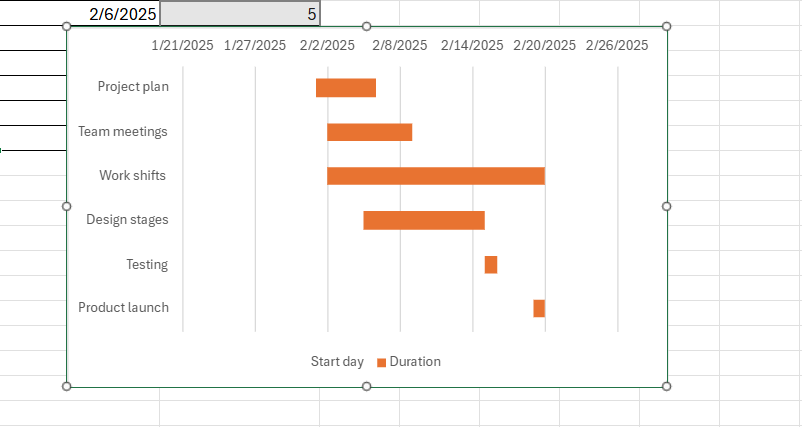
If you don’t want the legend to be reflected under your timeline, you can easily remove it.
Find Legend in the Format pane and click to activate or deactivate this option.
Here you can also add or remove the name of your timeline by simply clicking Chart Title.
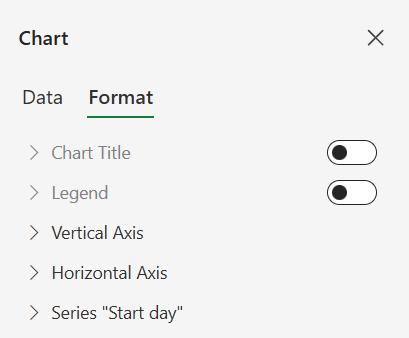
6. Use additional features to improve your project timeline
Feel free to customize the color of your timeline title and axes by adjusting the corresponding settings.
You may find them in the Format tab when you click on Chart Title.
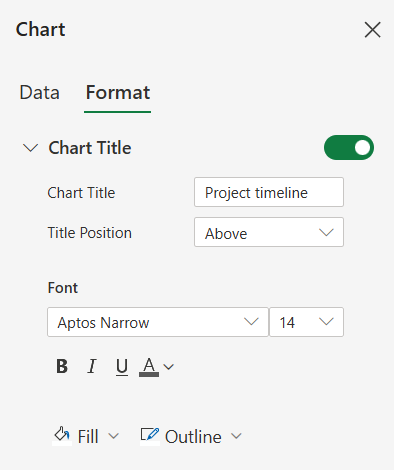
Excel also offers additional customization options for your chart.
To apply them, select the Chart tab on the ribbon at the top of your screen.
Click on it and you’ll see the options to modify axis titles, gridlines, date labels, and other chart elements to suit your preferences.

Finally, you can add your table right under the timeline. This option is also available in the Format pane.
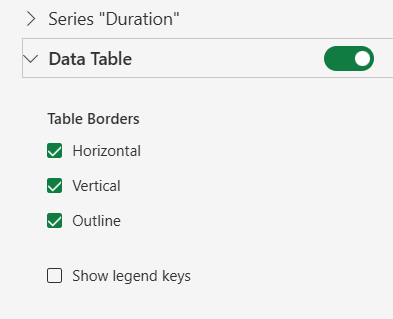
Now it’s time to check what your efforts have led to.
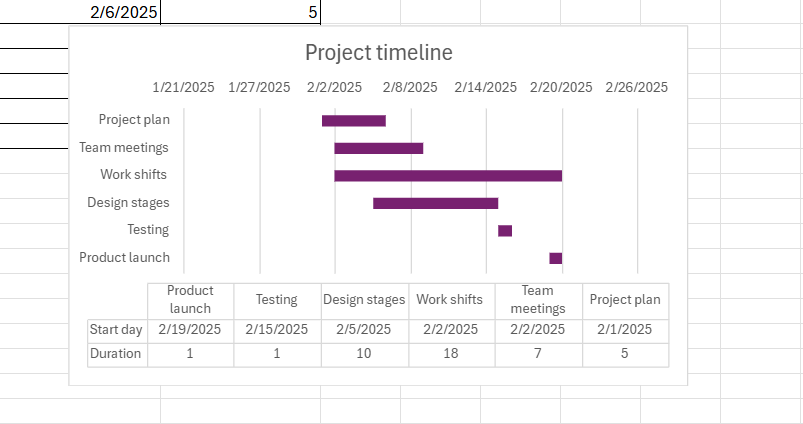
Congratulations! You’ve created a project timeline that’ll adjust itself based on the data you add to your table.
You can continue working with it in the Microsoft tool or, if necessary, transfer it to a robust project management solution. For example, many managers convert Excel to a Gantt chart to get more powerful features without losing their data.
Now, you probably want to know how to create a project management timeline in Excel with less effort and faster.
Option 2: how to create a project timeline in Excel using SmartArt
If you need a simple timeline, you can use the SmartArt feature in Excel to build one. This option is a quick yet effective way to visualize tasks and dates in a structured manner.
SmartArt is a built-in feature in Excel. It allows users to create handy diagrams and visual data representations. It offers a variety of pre-designed layouts, such as organizational charts, flowcharts, and timelines. These layouts are fully customizable, so you can adapt them to your specific needs without advanced graphic design skills.
The process of creating a project timeline with SmartArt is quick and easy. However, remember that this kind of timeline will be relatively basic.
Here are the steps to make it.
- Open Excel and select the SmartArt tool.
- Pick up a timeline layout.
- Add your project timeline data.
- Customize and adjust your timeline for better clarity.
- Save and share it.
1. Open Excel and select the SmartArt tool
First, open your Excel spreadsheet.
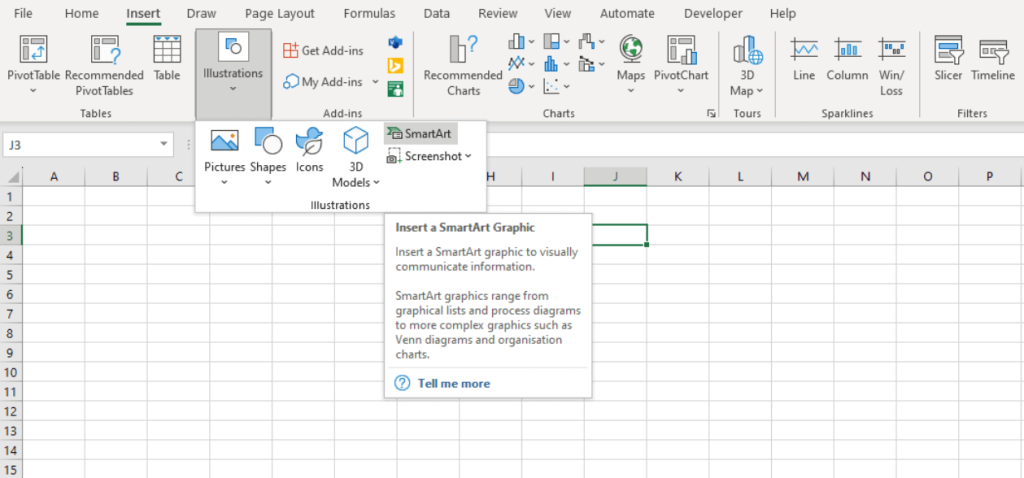
Then go to the Insert tab on the ribbon at the top of your screen. Find the illustrations group where you’ll see the SmartArt feature. Click on it.
You’ll get the options where you can choose an appropriate SmartArt graphic.
2. Pick up a timeline layout
You’ll see a list of categories on the left-hand side of the appeared window.
Click on Process to get process-related layouts and timelines. Depending on your preferences, choose a timeline layout like Basic Timeline or Circle Accent Timeline.
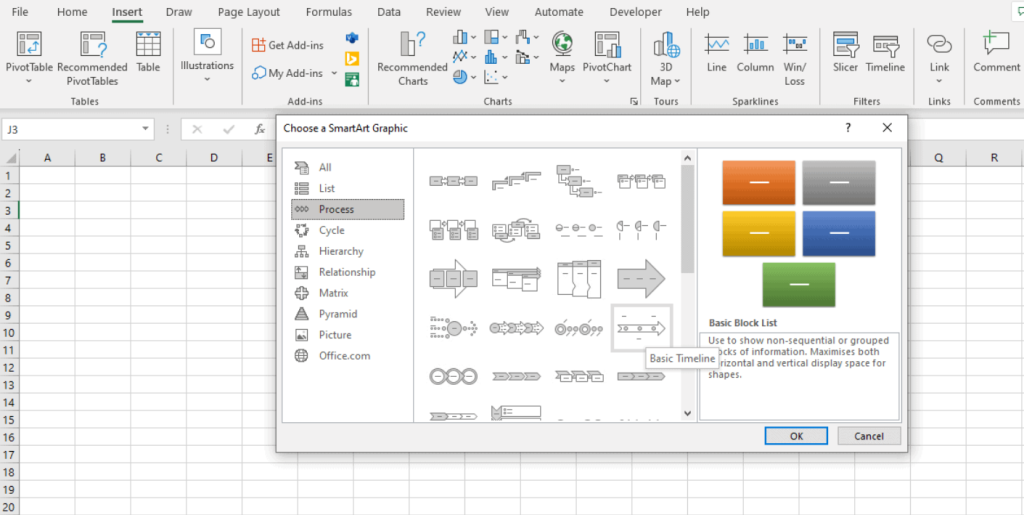
Click OK to insert the choice into your Excel sheet.
In our example, we add a Basic Timeline.
3. Add your project timeline data
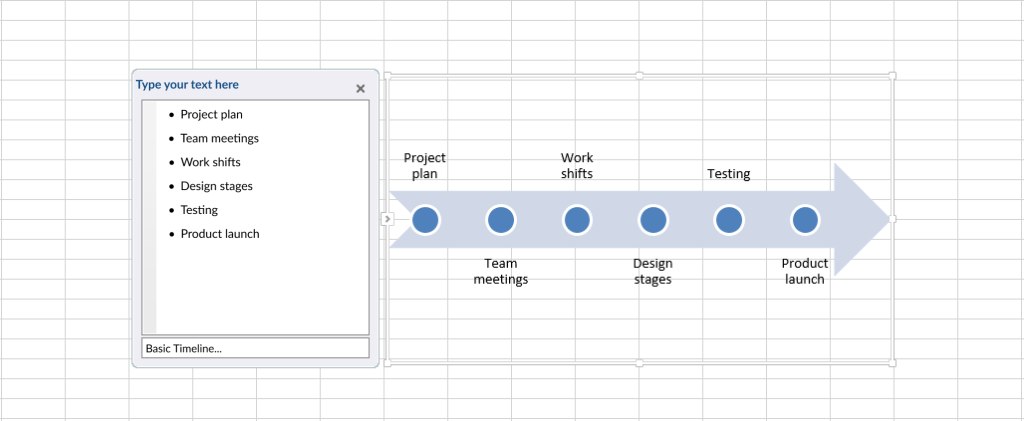
Once a timeline appears on your sheet, you’ll see a text pane on the left side of it. If it doesn’t appear automatically, click the small arrow on the left of the SmartArt graphic to expand it.
Add required information. For example, tasks, milestones, or dates. You can do it either in the provided text pane or directly on your timeline.
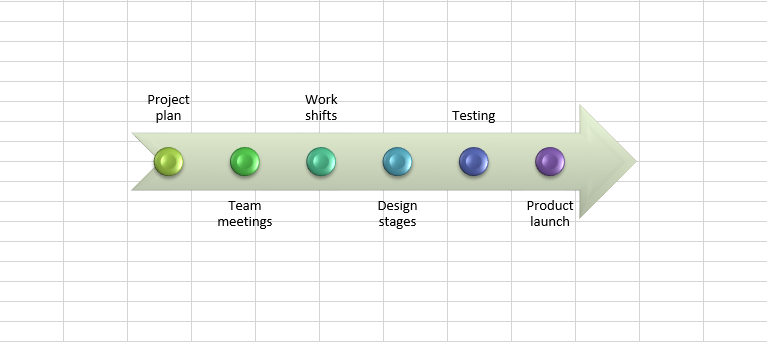
In our example, we enter task names.
4. Customize and adjust your timeline for better clarity
In Excel, you can also change the style of your timeline.
To do so, go to the SmartArt Tools Design tab, which you’ll find on the top ribbon of the menu, and click on it to see more layouts and color options.

After changing the style and color, our timeline example has a new look.
5. Save and share it
Once your project timeline is complete, save the file to preserve your work.
If needed, you can copy your timeline to other Microsoft Office programs, such as Word or PowerPoint, for reports or presentations.
You’re all set.
If you need something more detailed than SmartArt, but don’t want to build a timeline from scratch, use the third option.
Option 3: how to create a project timeline in Excel using templates
Excel timeline templates can be easily accessed through Microsoft Office’s template library.
While some templates require a Microsoft Office 365 subscription, most are available for free.
You can take advantage of this option to generate straightforward project timelines without the hassle of designing them from scratch.
Below are the quick steps to do it.
- Open Excel templates.
- Choose an appropriate Excel template.
- Customize the template for your project.
1. Open Excel templates
Before opening Excel, think about the tasks you will place on your timeline, as well as their start and end dates.
Keeping this data in mind, open Excel and go to the File menu.
Then select New from the sidebar menu to access the template options.
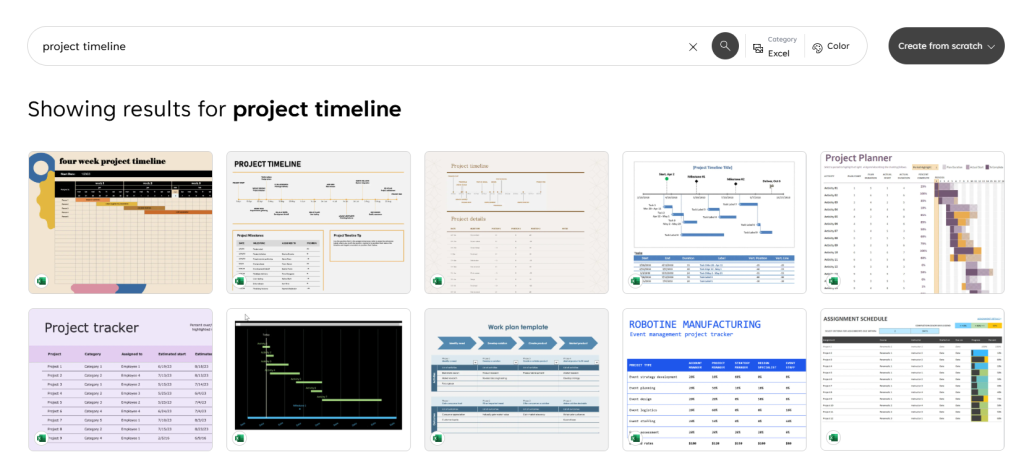
In the search bar at the top, type “timeline” or “Gantt chart” and press Enter.
2. Choose an appropriate Excel template
Select any option you prefer and click on it.
In our example, we select a Four-week project timeline template.
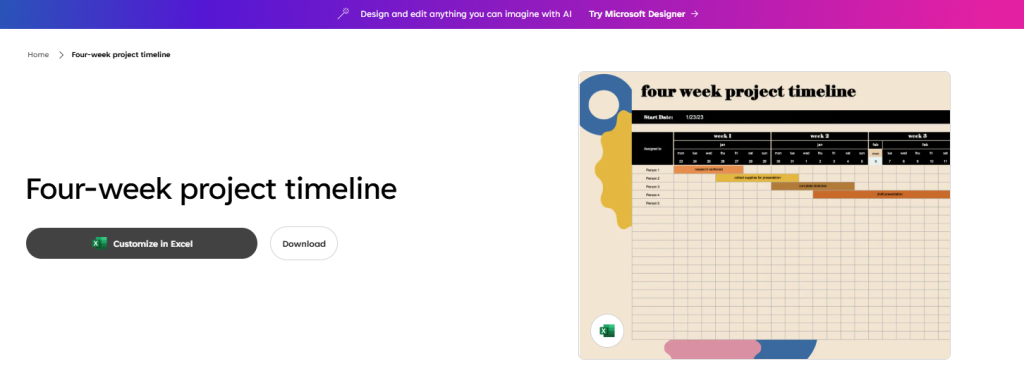
Download this template. Open it and review its structure to ensure it fits your needs.
Excel will let you customize a template, including its text, layout, colors, and more. However, if extensive edits are needed, it may be more practical to create a new timeline from scratch.
3. Customize the template for your project
Most Excel templates include data. Replace it with your project-specific information.
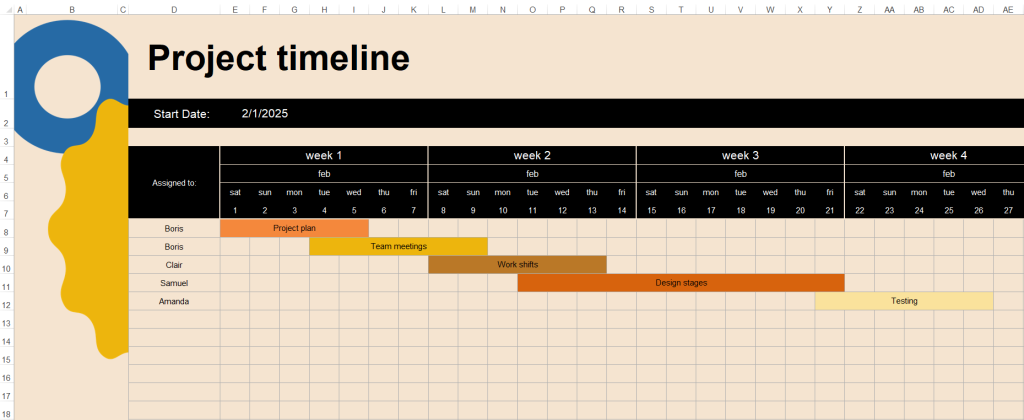
Finally, review and refine your timeline. Check for gaps or overlaps and verify accuracy.
After these steps, you can save your new project timeline and share it with anyone.
Don’t forget to consider your Excel file as a live document, updating it as the project progresses.
This approach can save you valuable time. However, it requires adopting a project structure aligned with someone else’s workflow.
Since your projects are unique, these templates might not be a good fit for your needs.
Let’s note some essential challenges that you may face while creating timelines with the Microsoft solution.
Common limitations of creating a project timeline in Excel
All of the above methods for building a timeline in Excel look useful. However, despite its effectiveness, the popular Microsoft tool has some evident challenges and limitations.
Here they are.
- Time-consuming setup. Creating a timeline in Excel is often tedious (especially the first option from our tutorial). Without built-in templates, users must start from scratch. This process can be inefficient and divert attention from actual project planning.
- Difficulties in managing updates. Project timelines often require frequent updates. In Excel, making changes can be cumbersome, especially if you have dependencies between tasks. The tool doesn’t automatically update connected elements. It increases the risk of errors and inconsistencies.
- Weak collaboration functionality. Excel is not designed for seamless real-time collaboration. When multiple team members make edits simultaneously, the changes may not sync. It may lead to inefficiencies in teamwork and even project delays.
- Lack of automation. Excel timelines require manual input for everything, from calculating task durations to aligning dates with milestones. There’s no automation to handle task dependencies or highlight delays. Therefore, you’ll need extra time to ensure accuracy and consistency.
- Poor visual appeal. While Excel perfectly supports charts and graphs, it isn’t inherently designed for visually compelling timelines. The lack of advanced customization options often results in plain or cluttered visuals.
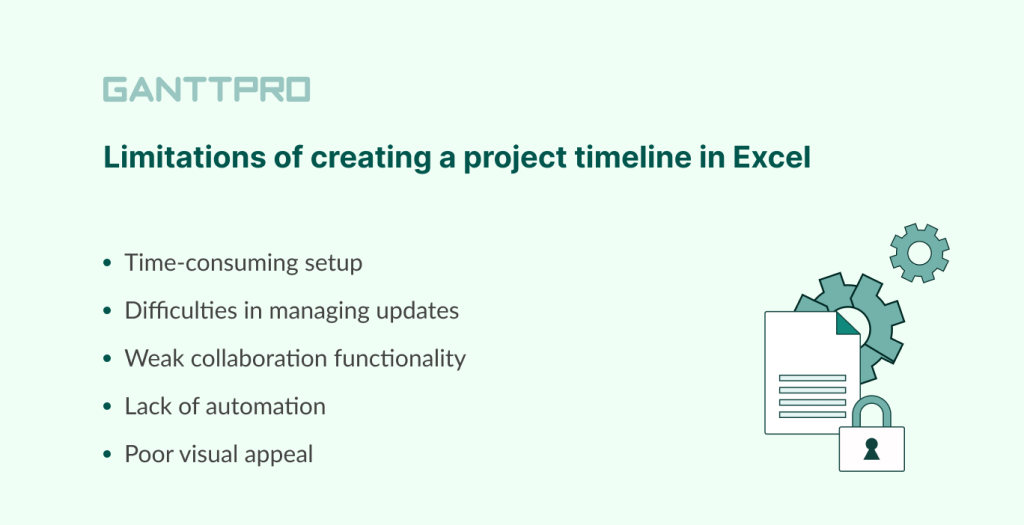
Each of these limitations and shortcomings can lead to inefficiency and misunderstandings in a team. That’s why users often look for timelines created in available Excel alternatives.
Here’s what Kowsyap Pranay, a software engineer at MSRCosmos LLC, a global IT services company, thinks about it:
Excel only provides basic data visualizations such as graphs and charts, so creating more complex ones is a challenge. Performance tends to be slow when attempting to open large workbooks. Furthermore, sharing documents with others is not easy in this.
Overall, it’s up to you whether to build a timeline using project management software or Excel.
However, take the most out of a great Microsoft tool replacement that is on the surface. It’s all about GanttPRO — a powerful Gantt chart tool.
How to create a project timeline in GanttPRO
GanttPRO is one of the best project management timeline tools that allows for creating multifunctional Gantt charts in minutes. It is widely known for its advanced features, affordable pricing, ease of use, and flexibility.
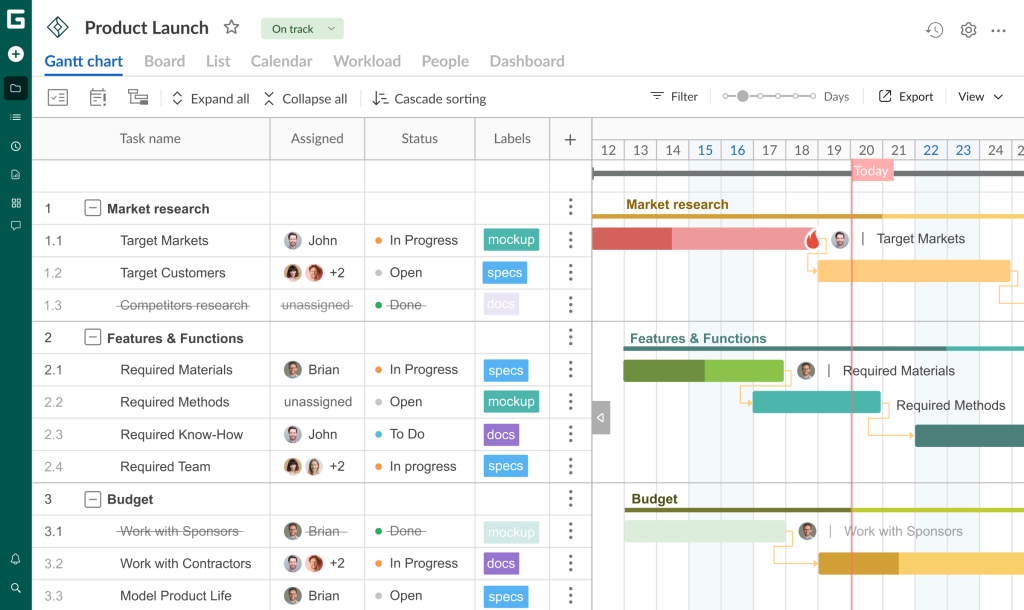
GanttPRO allows for generating comprehensive diagrams with task planning and resource allocation. With their help, you can easily schedule, organize, assign, and track any project activities and assets without headache.
Professionals involved in project management also appreciate GanttPRO for advanced time management, communication, deadline control, progress tracking, and other features.
Jhonder Paredes is among these professionals. The manager at Construcciones Da Costa, S.A., considers GanttPRO an excellent option:
GanttPRO helps me streamline project planning by allowing me to quickly create detailed Gantt charts. Importing my work breakdown structure (WBS) from Excel was seamless. It saved me time on manual entry. The simplicity of the platform helps me focus more on managing my project rather than learning the tool.
What sets GanttPRO apart from Microsoft Excel?
First and foremost, it’s the ease and speed of making project timelines. GanttPRO’s online Gantt chart not only simplifies this process but also enhances it with powerful features that turn a timeline into a strategic asset.
Whether you’re working on IT projects, construction, or any other complex endeavor, GanttPRO empowers you to plan and manage with precision and efficiency.
The software is great for both timeline and Gantt chart creation. This is especially useful for those young professionals who don’t really understand the differences in the “Gantt chart vs timeline” pair.

Robust Gantt chart software
Plan and manage tasks and resources on an online project timeline.
Sign up for freeCreating a project timeline in GanttPRO is an effortless process that can be realized even by a student or an employee without experience.
Let’s explore the steps for generating a stunning project timeline in this Gantt chart maker.
- Create a project.
- Add tasks with dates.
- Invite team members and organize resources.
- Assign tasks.
- Link dependent tasks and mark milestones.
- Share your timeline.
1. Create a project
To get started, register in GanttPRO using your email address or Microsoft, Google, Facebook, or LinkedIn account.
If you’re already a GanttPRO user, just log in to your account. Find the Create new project button located in the top left corner of your page.
Once you click this button, you’ll get two options:
- Create a new project.
- Create a project portfolio.
Select the first one and proceed to fill in all necessary details in the appeared settings window.
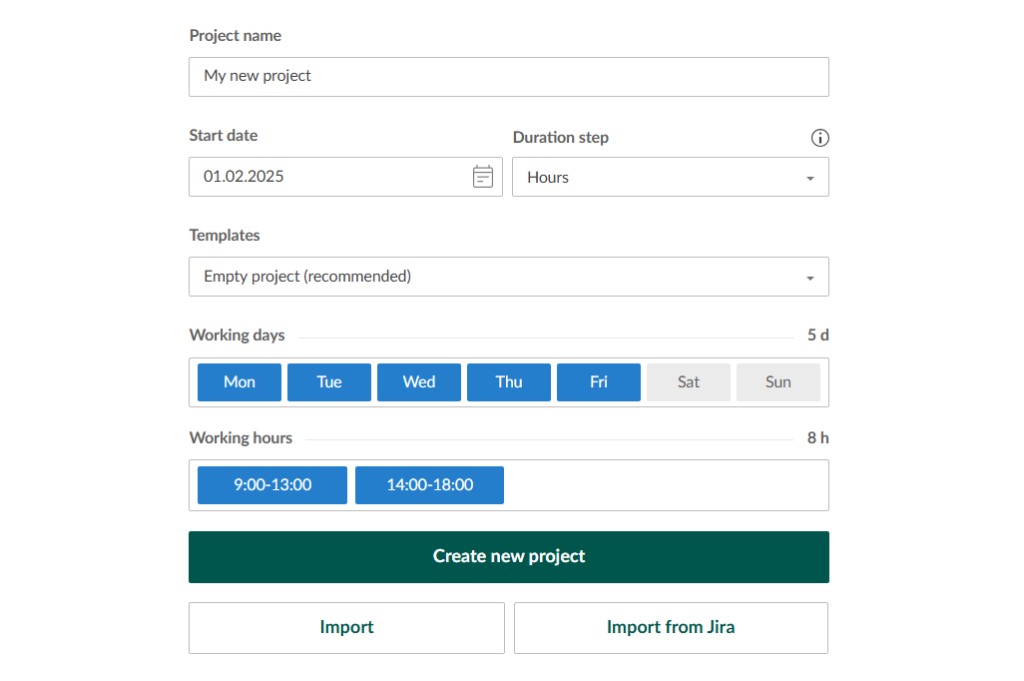
GanttPRO offers a wide range of pre-designed Gantt chart templates to choose from.
No matter the type of project — be it marketing, IT, consulting, construction, education, or something else — you’ll find a template that can be customized to suit your specific requirements.
2. Add tasks with their dates
Once your new project is created, you can visualize all tasks along with their start and end dates and duration.
Visualization in GanttPRO is a quick and straightforward process. In just a few minutes, you can add tasks and subtasks, set dates, and structure your timeline logically — all without the extra steps typically required in Excel. The duration of activities is calculated automatically here.
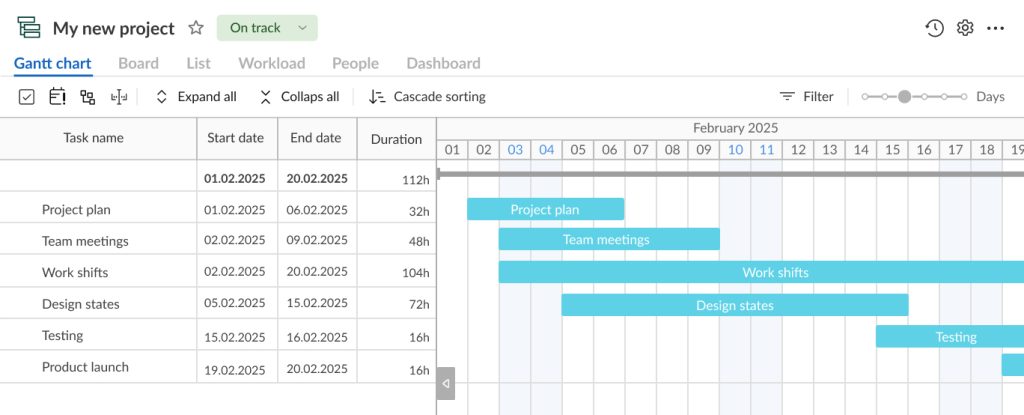
In GanttPRO, you can apply a work breakdown structure. This tool assists in achieving the required work hierarchy.
By the way, it can serve as a great alternative for anyone seeking how to create a WBS in Excel since Microsoft Office’s approach to structuring tasks looks cumbersome and less user-friendly.
In contrast, a WBS in GanttPRO is clear, as in the image below.
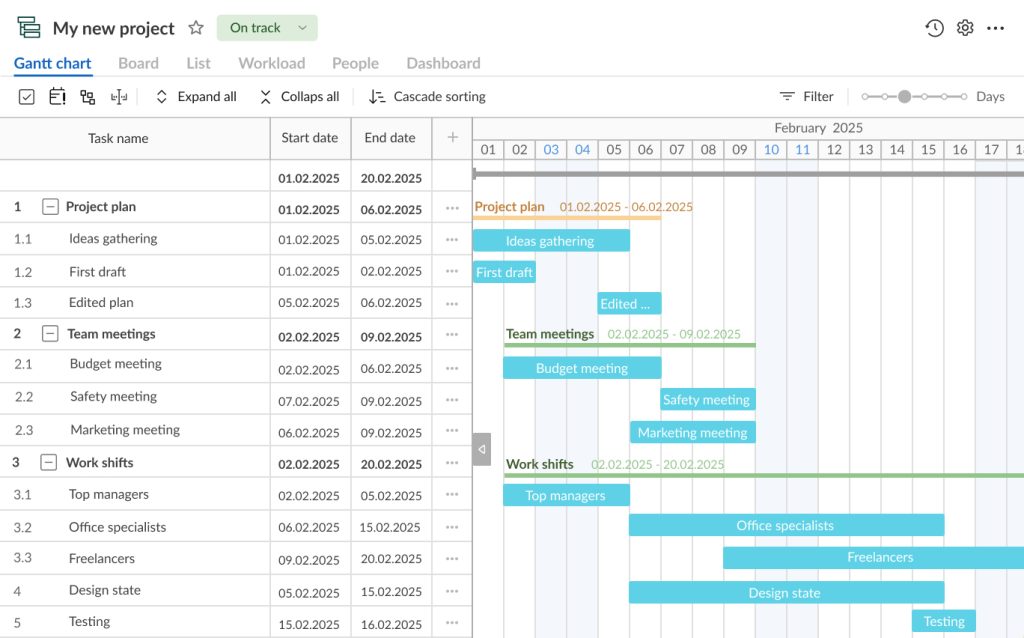
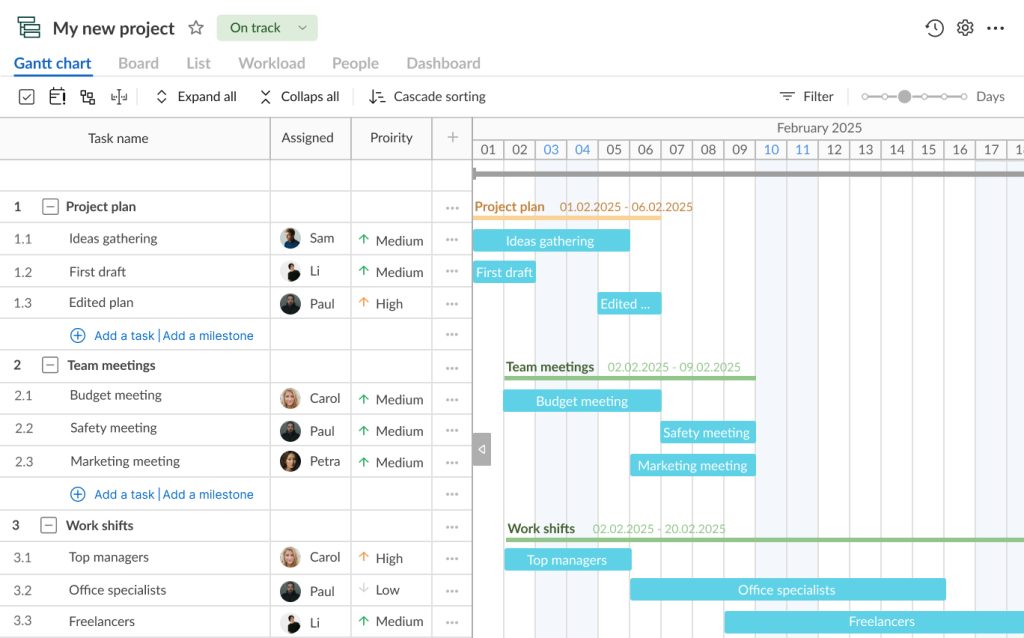
You can display additional fields in your project’s grid to the right of task titles to make project management more efficient. For example, you can add status, assignees, priority, budget, estimation, and more.
It is also possible to hide unnecessary fields or create your own ones to fit your specific needs.
3. Invite team members and organize resources
Your GanttPRO project may visualize all the people involved in it as well as the necessary resources required for work management and completion.
Simply invite and manage people and virtual resources here. Specify their rights, working time units, and costs.
4. Assign tasks
Now you can assign resources to the defined tasks.
Your assets may include labor, materials, vehicles, hardware, software, etc.
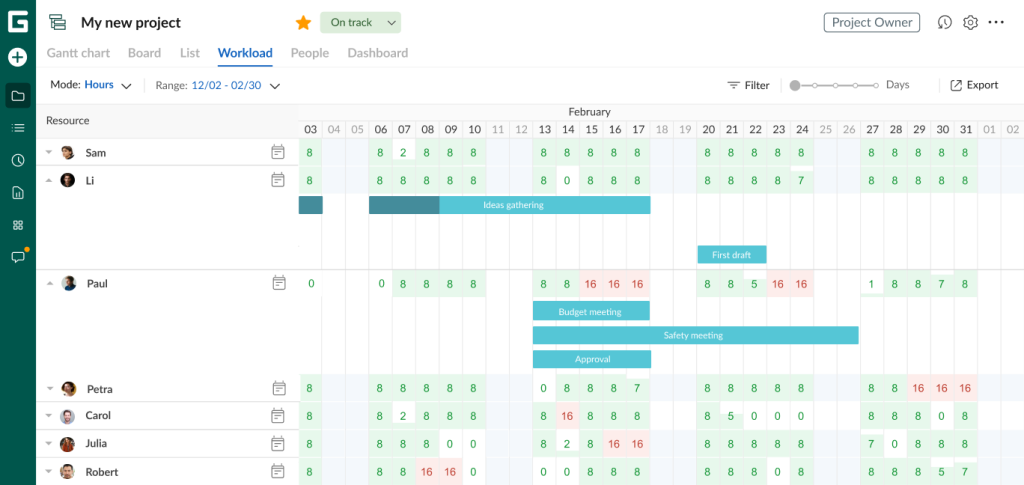
With the help of the workload feature, you can control how your team members are loaded with tasks.
In case someone from your colleagues is overloaded, a red human icon will appear near the overloaded assignee.
5. Link dependent tasks and mark milestones
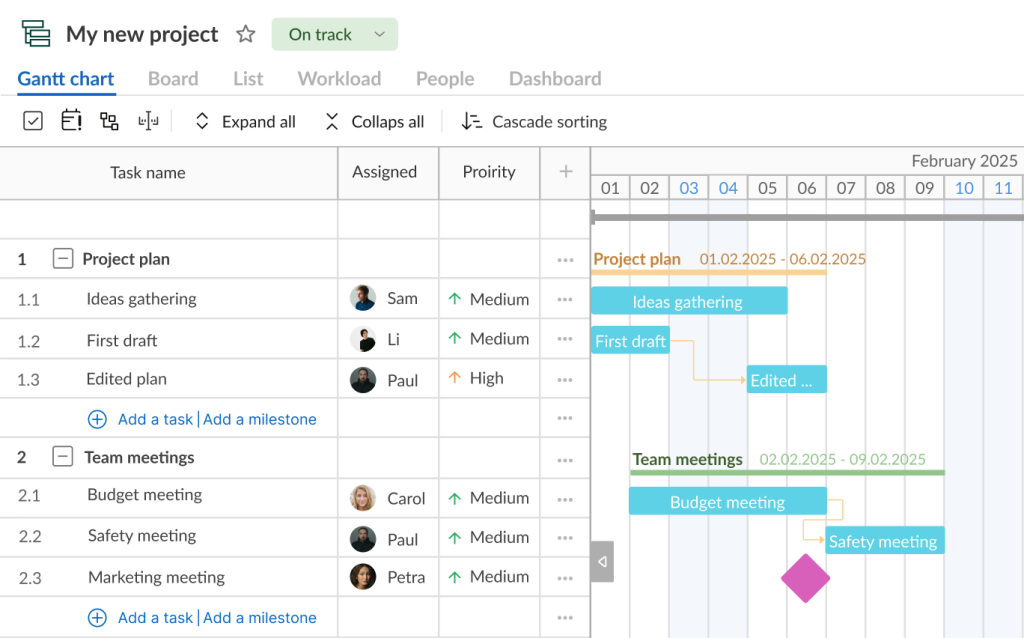
The ability to define task dependencies is a standout advantage of using a GanttPRO timeline compared to an Excel option.
In GanttPRO, you can effortlessly establish task dependencies using intuitive drag-and-drop or by configuring them directly within the task settings.
For instance, the end date of one activity can provide a start date for another one, ensuring a smooth and logical workflow.
Additionally, if your project requires a clear focus on key moments or major events, GanttPRO lets you place milestones directly on a timeline. These milestones act as checkpoints and help you stay on top of critical project goals ensuring you never overlook significant achievements.
6. Share your timeline
GanttPRO allows for sharing your project timeline. You can create one or more links to your project and share them with team members and all stakeholders involved.
It’s easy to export all essential project data, including task dependencies, milestones, and deadlines, in PDF, PNG, XLSX, or XML formats.
These were four different but effective methods in their own way. After studying them, you should definitely have an idea of how to create a timeline for a project in Excel and the robust Gantt chart tool.
Create a project timeline in Excel or choose GanttPRO to streamline the process and save time
Excel offers several approaches for creating a project timeline. However, these options may often seem complex and not user-friendly.
If your project demands a more detailed and clear timeline that highlights tasks, duration, dependencies, milestones, and resources at a glance, it’s worth trying GanttPRO.
Whether you opt for Excel or a robust Gantt chart-based tool, a project timeline will streamline your planning, ensure smooth progress, and offer your team an intuitive and visually engaging workflow.
Read also
Join 1M+ project managers!
Create Gantt charts in minutes with GanttPRO and reduce time spent on managing tasks by 40%
Try for freeNo credit cards required. No obligation.
