How to Create a Project Timeline in PowerPoint: 2 Practical Ways & Solid Alternative
Audio version:
Teams across various industries use a project timeline to stay on track and visualize key work processes. It can be created not only with the help of powerful planning tools but even with publicly available platforms such as PowerPoint.
How to create a project timeline in PowerPoint? Are there different ways to do it and what steps are essential for success?
This article provides detailed answers and an alternative approach for generating a visually impressive timeline using a robust Gantt chart maker.
At the end of the article, you’ll also find a video overview.
Contents:
- How to create a project timeline in PowerPoint using a simple table.
- How to create a project timeline in PowerPoint using SmartArt.
- How to create a project timeline in GanttPRO.
How to create a project timeline in PowerPoint
If you think that PowerPoint is no longer relevant for modern managers and teams, some studies can change your mind.
One of them is the research showing that this popular Microsoft tool continues to be an essential resource for people creating presentations.
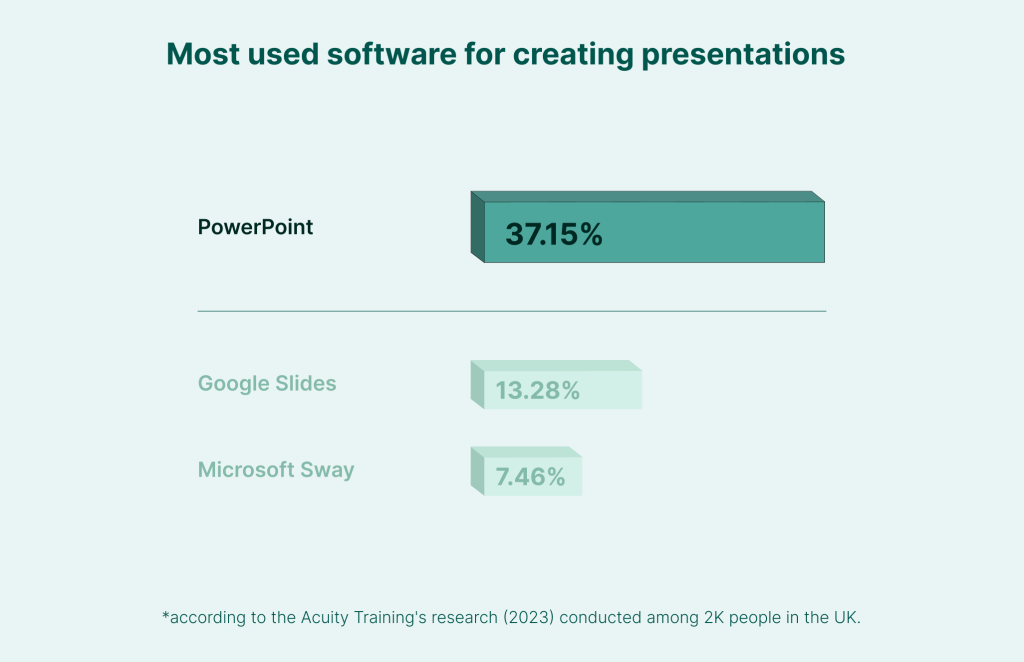
Preparing presentations is the core functionality of this tool. However, it is also widely used for generating timelines.
How to create a project timeline here?
The users of Microsoft PowerPoint usually highlight 2 main ways of using this software to make project timelines:
- With the help of a simple table.
- With the help of the SmartArt feature.
Let’s dive into these approaches and explore each step, accompanied by relevant visuals.
But before we start, make sure you have gathered all the information required for your future project timeline.
Option 1: how to create a project timeline in PowerPoint using a simple table
PowerPoint provides built-in tools, like a basic table, that can be used to create simple timelines.
However, it requires time and patience since you’ll need to carefully follow each step in sequence without overlooking any details.
Here’s how you can implement this time-consuming yet effective approach.
- Open a PowerPoint slide and insert a table.
- Adjust the visual parameters of your table.
- Adjust the technical aspects of your table.
- Insert your project data.
- Add bars to make a timeline.
By the way, you may find these steps familiar if you’ve ever explored how to make a Gantt chart in PowerPoint.
1. Open a PowerPoint slide and insert a table
Open PowerPoint and go to the Insert tab on the ribbon at the top of your screen. Click on it.
You’ll see a tab titled New Slide on your left.

Click on it to get different layouts for a presentation.
For our example, we’ll use a Blank presentation.
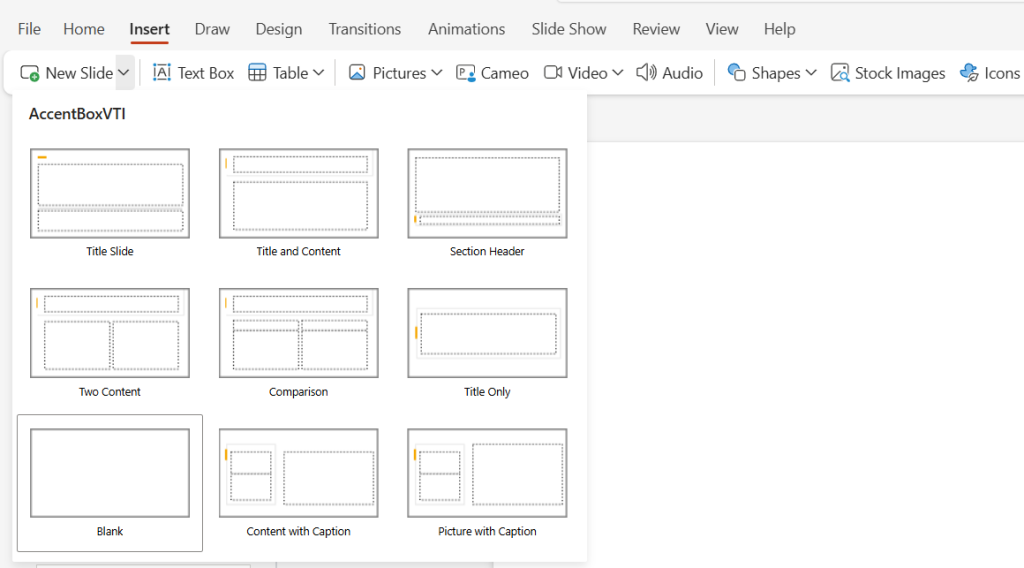
Now you can see an empty blank that can be filled with the required data.
Then go to the Insert tab again and find Table. Here you should select the number of cells and rows for your future table.
When you select them, click Enter.
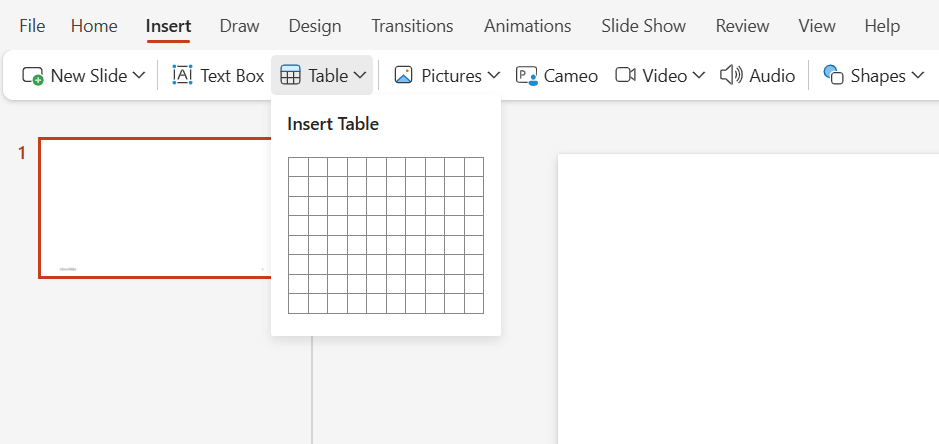
In our example, we add 1 row and 17 columns.
If you need to add some more cells or rows, select the required number (for example, 6 cells) and go to the Insert tab again. Click it and you’ll get additional options for adding.

Here we decide to merge 3 first cells to make a column for tasks. 14 cells will be used for months later.
Select the required number of cells by clicking on them and dragging them to the side. Then go to the Table tab on the menu ribbon. Click on Merge.

Now you can increase the height of the future columns to let them fill the entire blank. It can be done manually by reaching for the edge of the table and using drag-and-drop or by clicking on Format Table (this tab is located under the main menu ribbon in the same line as Merge).
By clicking on Format Table, you’ll get the option for formatting the width and length of your table on the right side of your screen.
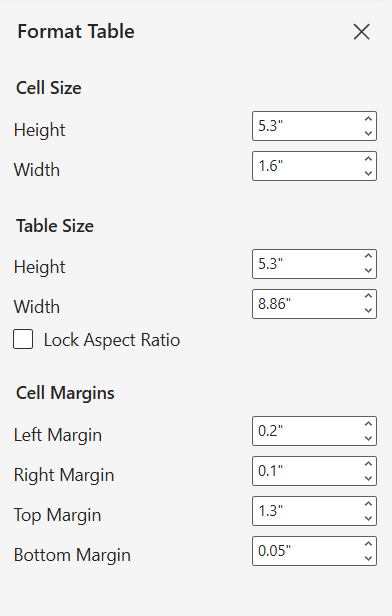
Here’s what you can get after this step.
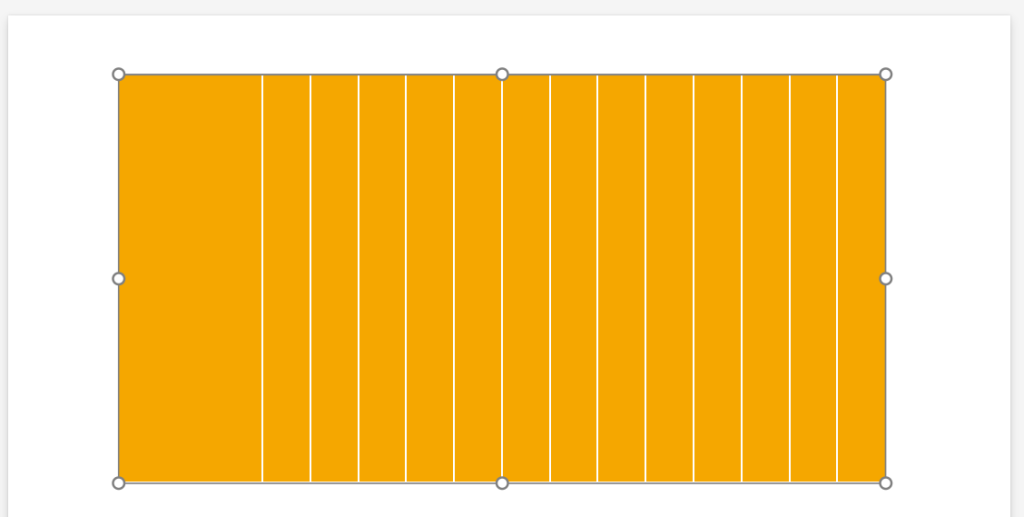
2. Adjust the visual parameters of your table
Now when you have the table, let’s work with its visual appeal.
You can change its color and pick up the type of border visualization.
To do it, go to the right side of the pane in the Table tab.
There you will get options to make visual changes to your table.

In our example, we choose grey color and white borders for a future project timeline.
Alternatively, you can select the Shading option and choose No Fill so that your table does not have a background color.
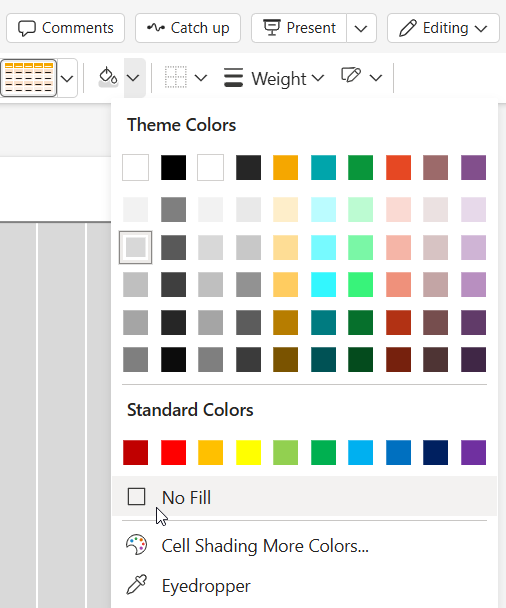
3. Adjust the technical aspects of your table
Now, you can optimize the technical aspects of your future project timeline.
It’s possible to split any column into multiple rows.
For that, select the required column and choose Split in the Table tab.

After clicking on Split, you will see a window with options for choosing the number of columns and rows.
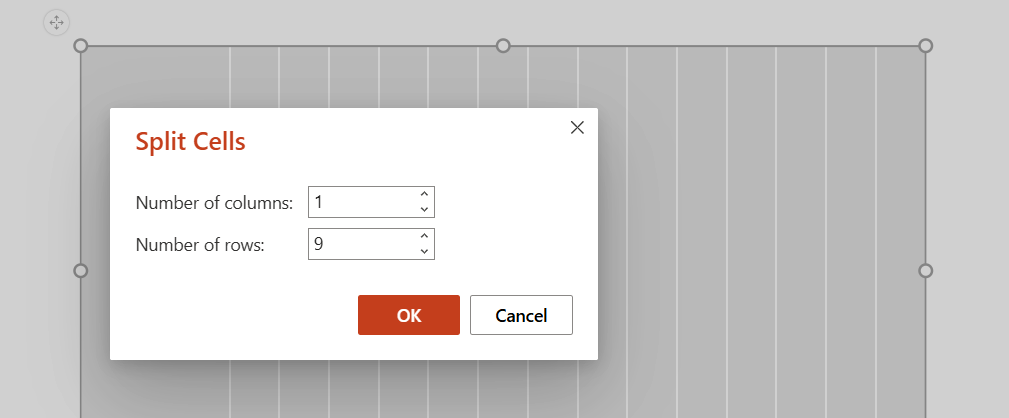
Select the number of rows depending on the number of tasks you have.
In our example, we choose 9 rows for the first column.

4. Insert your project data
Now you can insert tasks into these rows.
In our example, the first row will be used for a title.
It’s possible to edit text color, alignment, and other attributes according to your preferences using the built-in editing panel that appears when you hover over it.
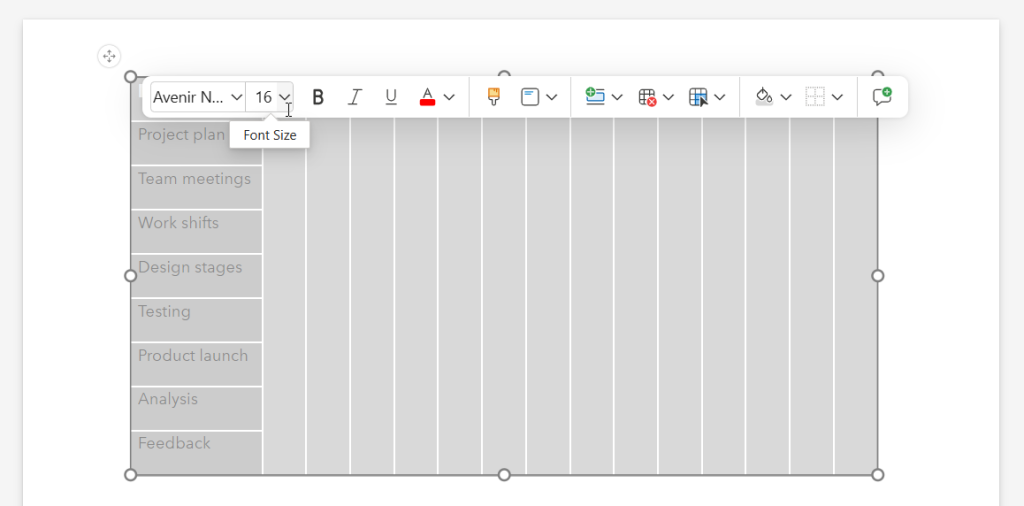
When your rows are filled, you can add months.
Simply click on a specific column and start typing at the top or bottom of it.
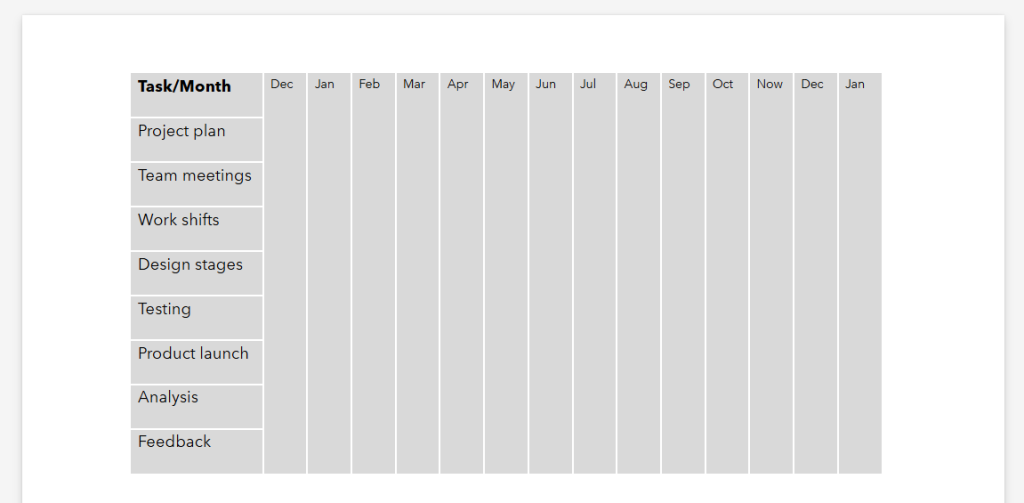
In our example, we use the abbreviation of months placed at the top of the columns.
Here’s how the table looks now.
5. Add bars to make a timeline
Now it’s time to start adding task bars.
To do it, go to the Insert tab, find Shapes, and choose Rounded Rectangle in the appeared window.
Click on it and paste near a specific task. Then you can simply copy and paste it for each task.
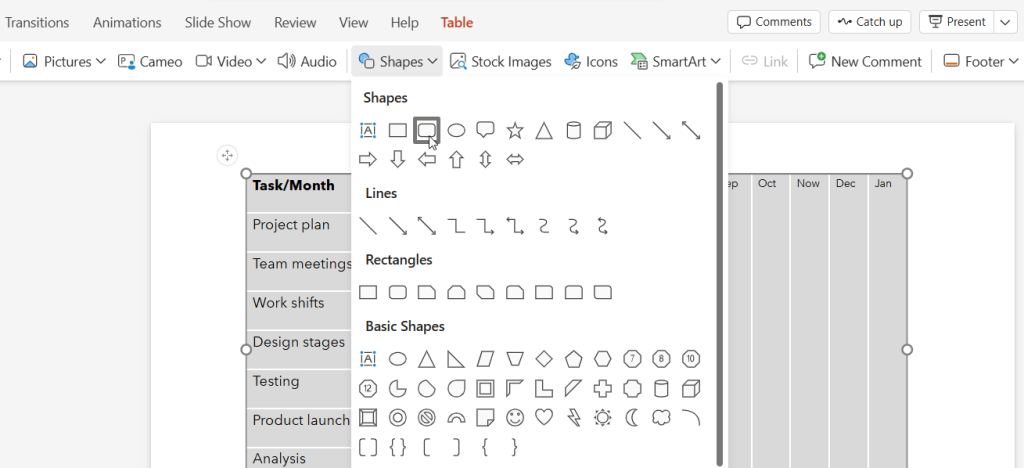
It will allow you to add rectangles similar to typical Gantt chart bars for each task considering their duration and start and end dates.
In our example, we use months on the timeline, so we don’t need precise date details.
In PowerPoint, you can also change colors for your tasks to differentiate them. Color variants and some other stylistic options will appear when you click on each rounded rectangle.
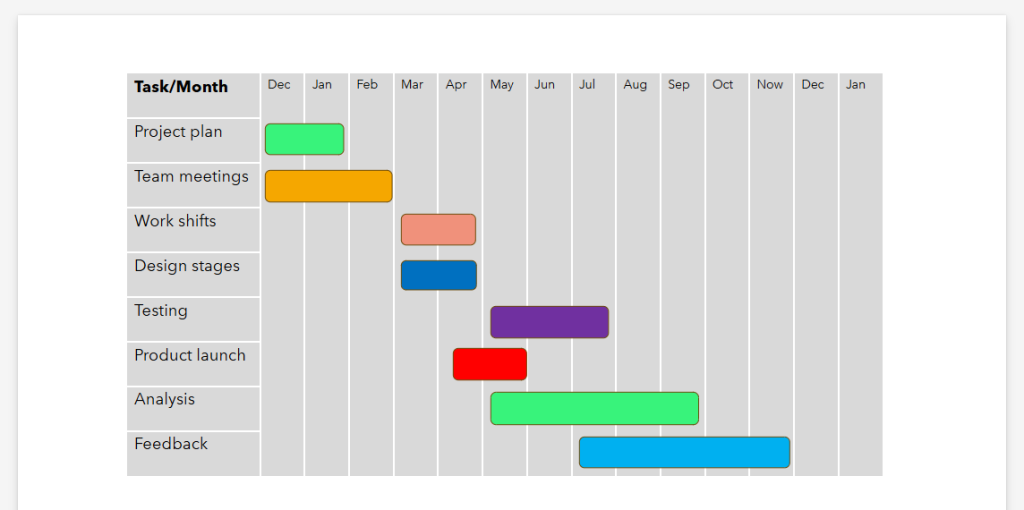
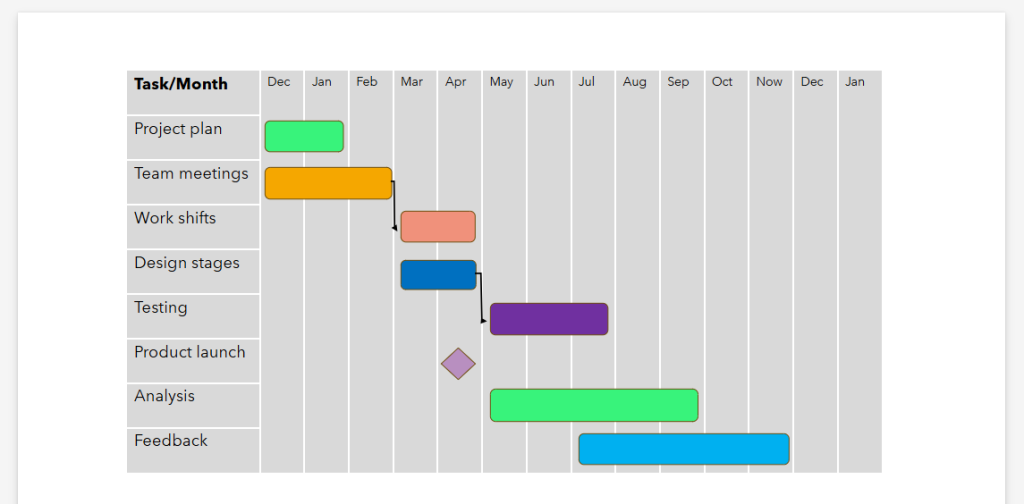
Besides, you can take the same steps to visualize possible dependencies between tasks.
Go to the Insert tab, select Shapes, and find Elbow Arrow Connector to apply it for showing needed connections.
To link rounded rectangles, click on the edge of one and drag the arrow to the desired edge of the other one.
In the same way, you can change a task to a milestone using the Diamond shape.
Simply delete the rectangle you want to remake and insert this kind of shape instead. You may select an alternative variant but the form of diamond is most often used to visualize a milestone on timelines.
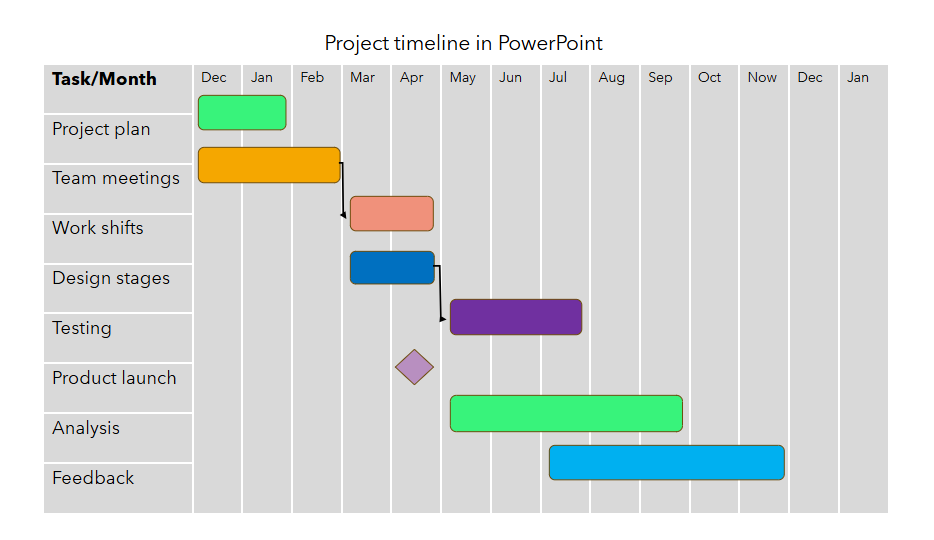
If necessary, you can also add a title to your project timeline.
For that, click on the timeline location where you want your title to appear.
Go to the Insert tab and select the Text Box. Click on it and type a title. Then press Enter.

That’s it. Your project timeline in PowerPoint made with the help of a simple table is ready.
How do you find this method?
If you’re looking for a simpler process, you’d better explore how to make a project timeline in PowerPoint with the help of the SmartArt feature.
Option 2: how to create a project timeline in PowerPoint using SmartArt
Creating a PowerPoint timeline can be quicker with the help of SmartArt.
This built-in Microsoft feature streamlines the process, enabling you to design a simple and visually appealing timeline without requiring advanced graphic design skills.
SmartArt offers a range of pre-designed layouts, including organizational charts, flowcharts, and timelines. They can be easily customized to suit your specific needs.
Below are the exact steps that will assist if you wonder how to show a project timeline in PowerPoint with SmartArt:
- Create a blank.
- Add the Basic Timeline layout.
- Add your data.
- Format your timeline graphic and add more details.
1. Create a blank
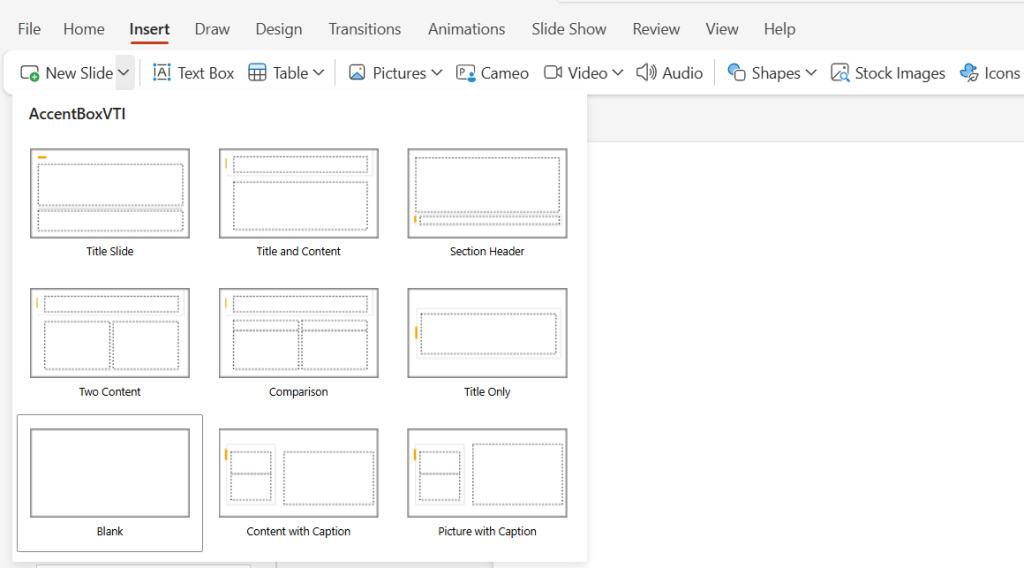
Start a new presentation and add a blank.
To do it, go to the Insert tab on the ribbon at the top of your screen and find the New Slide section. Click on it and select Blank from the drop-down menu.
The empty slide you get will help you to create a project timeline.
2. Add the Basic Timeline
Go to the Insert tab again. Find SmartArt there and click on it.

When the pop-up window appears, go to the Process category where you’ll find a range of graphic options for your timeline.
If you need a simple graphic that will clearly demonstrate your key project tasks, dates, or events, pick up the Basic Timeline and click OK.
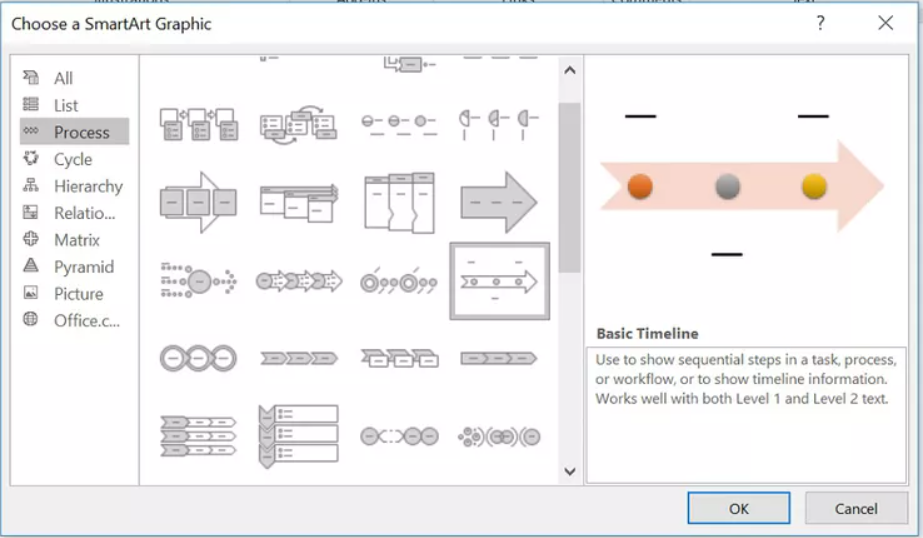
If you want to try out other timeline layouts, feel free to choose different options from the collection and paste them into your slide.
3. Add your data
At this stage, your default timeline will look like the image below.
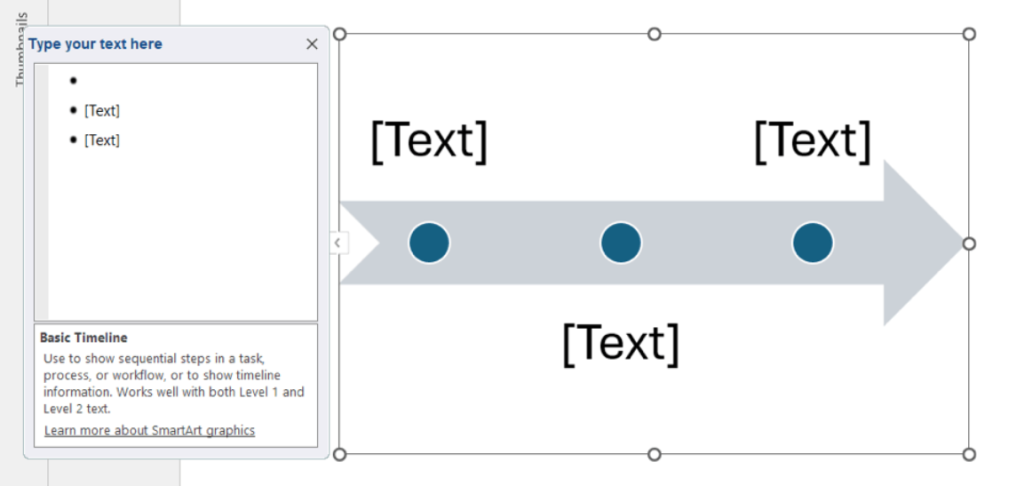
By default, it has 3 points and places to enter text.
Insert data right on the graphic by typing it inside the [Text] boxes or use the text pane instead — you can find it on the left side. If this pane is not visible, click on the small icon on the left of your timeline arrow to open it.
Here you can easily add extra points to your timeline.
To add a new one, press Enter after an existing item in the pane and type your data.
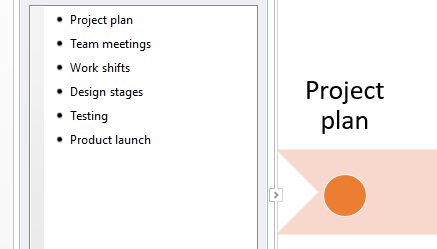
In PowerPoint, points on a timeline are spaced evenly, regardless of the actual time intervals between their dates.
While you can manually adjust the spacing by dragging points closer together or farther apart, doing so may distort the layout, especially as more items are added. It’s better to stick with the default spacing to maintain a clean and professional appearance.
Additionally, PowerPoint automatically reduces the font size as you add more events to ensure everything fits within the timeline. However, this can impact readability, so it’s important to balance the number of points with the clarity of your presentation.
4. Format your timeline and add more details
Now, you can format and customize your PowerPoint timeline to make it stand out with unique styling options.
To enhance its appearance, use the SmartArt design tab on the ribbon to adjust styles and choose from various color palettes.
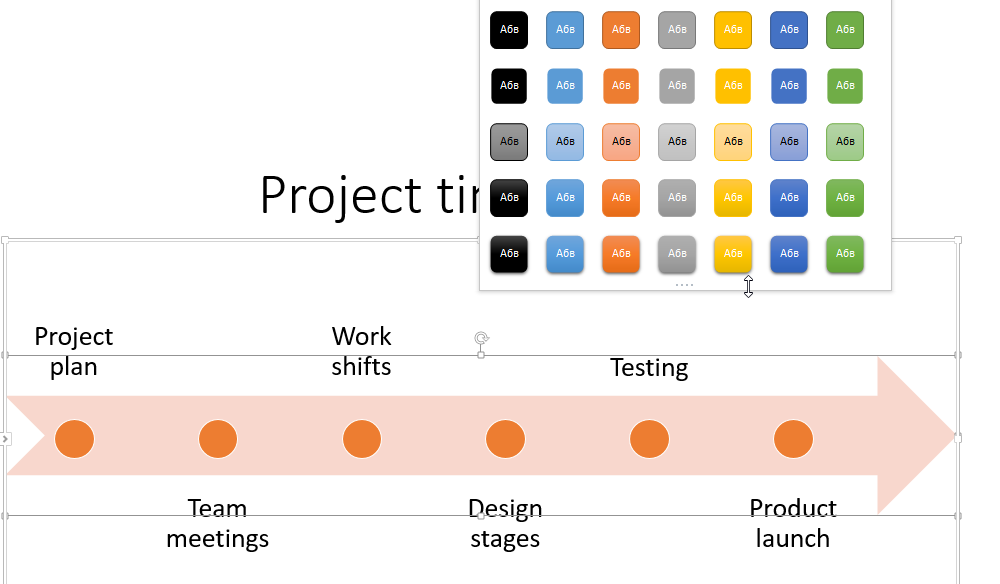
SmartArt not only lets you customize an entire timeline but also enables you to modify individual elements for a truly personalized design.
To make these changes, simply click on any item and explore the formatting options to adjust its appearance.
For instance, you can use the Shape Fill tool to emphasize key points, making them more noticeable, or change the Font Color of dates to differentiate them from point descriptions. It can make your timeline more visually engaging and highlight crucial details.
To further enhance the design, experiment with various shapes and sizes for points.
After exploring the available options, here’s how our updated timeline may appear.
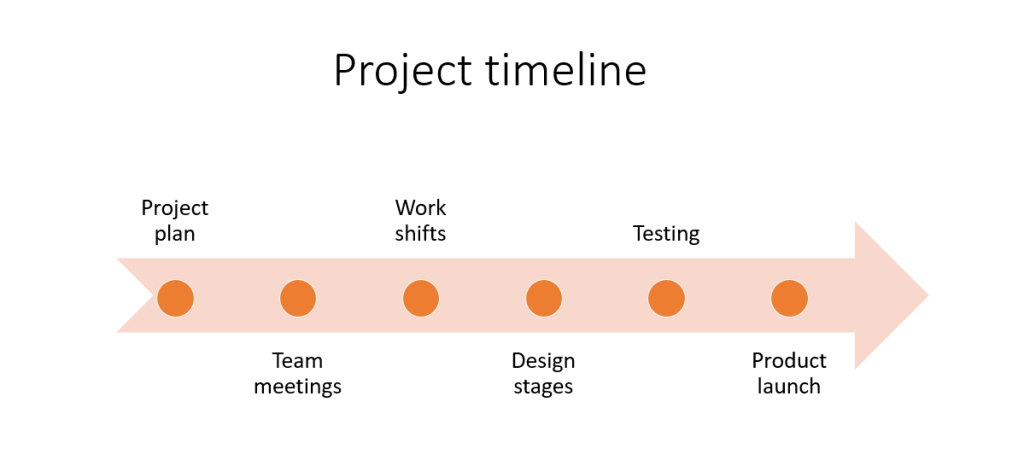
These were 2 different steps for manually creating a timeline in PowerPoint.
As you see, both project timeline examples described above are not so detailed and quick for creation. Therefore, it’s a good idea to explore a more powerful approach to creating a trustworthy project timeline.
There is a way to generate a timeline that is most suitable for professional project managers and their teams. This method is based on the use of a Gantt chart.
To better explore this approach, you’ll need a powerful online tool.
One of the leading project management timeline tools famous for its accessibility, user-friendliness, and flexibility is GanttPRO.
How to create a project timeline in GanttPRO
GanttPRO is a comprehensive project management tool that enables companies to streamline planning processes, guiding them from concept to completion.
This Gantt chart tool perfectly suits various teams involved in software development, manufacturing, construction, retail, healthcare, education, and other spheres.
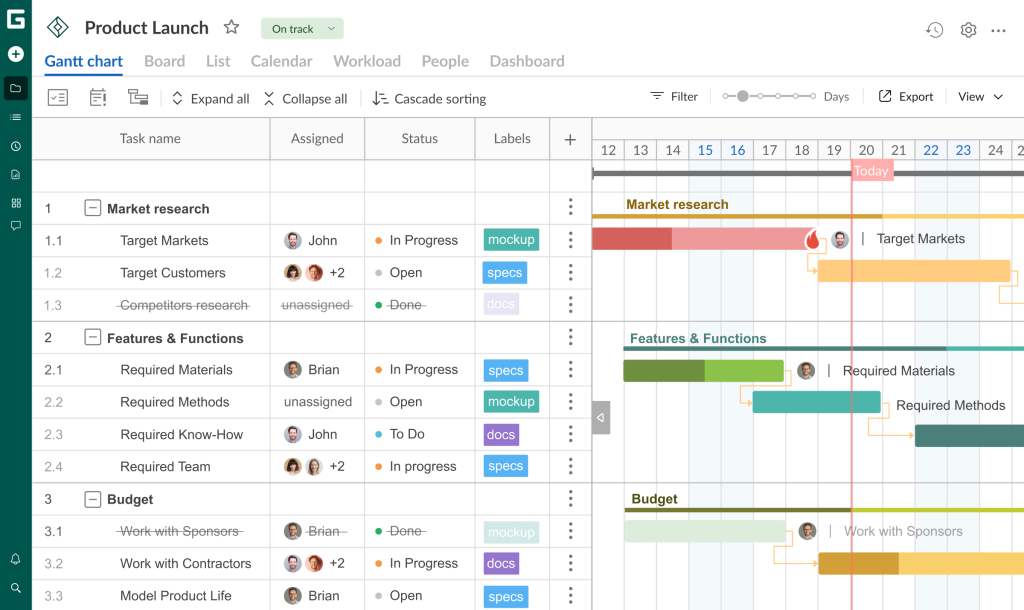
The software helps all-sized businesses visualize projects of any complexity, schedule tasks, allocate resources, manage workflows, set deadlines, and track progress with ease. A Gantt chart facilitates breaking down projects into tasks, setting dependencies, and marking key milestones.
GanttPRO users can collaborate with both in-house and remote team members and share timelines with all stakeholders involved. Advanced budget control functionality is also included.
What truly distinguishes this platform from PowerPoint and other project timeline makers is its ease of use and speed in scheduling. It not only streamlines the timeline creation process but also enriches it with robust features that transform a simple timeline into a powerful strategic tool.
Additionally, many users appreciate GanttPRO’s user-friendly interface. One of them, Maddie B, a game developer, admits:
GanttPRO’s intuitive design is one of its most notable qualities. Even though I don’t come from a project management background, I had no trouble learning how to utilize it. Using the simple drag-and-drop interface, you can quickly and easily create a Gantt chart, timeline, and task dependencies.
Ready to see how it works?
Let’s dive into the steps for creating a stunning project timeline using this versatile Gantt chart maker.
- Initiate a project.
- Divide your project into manageable tasks and subtasks.
- Involve team members and allocate resources.
- Assign tasks and balance workload.
- Add task dependencies and highlight milestones.
- Keep everyone informed by sharing your project timeline.
1. Initiate a project
Creating a new project in GanttPRO is a quick and hassle-free process.
To register, use your email or Microsoft, Google, Facebook, or LinkedIn account (in case this is your first time in GanttPRO).
If you already know how to use the robust Gantt chart creator, then simply log in to your account.
Find the Create new project button located in the upper left corner of your page.
After clicking this button, you will be asked to create a new project or a project portfolio. Choose the first option and enter all the necessary data in the settings window that will appear.
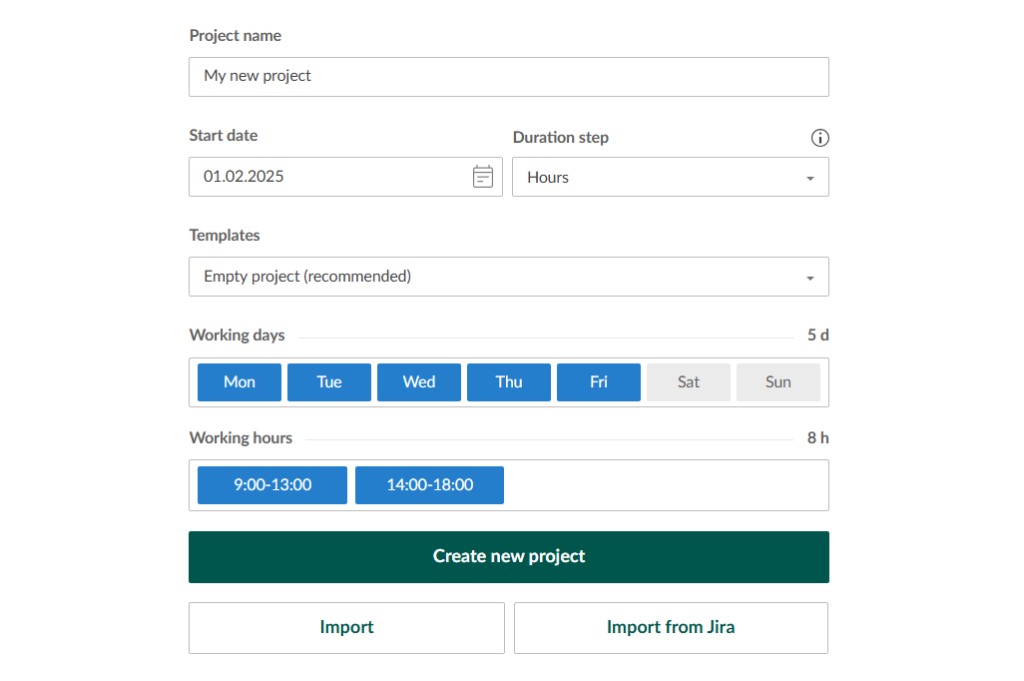
If you need a quicker start, use GanttPRO Gantt chart templates. You will get pre-made timelines designed for software development, education, construction, manufacturing, retail, and other industries. All of them can be customized to suit your requirements.
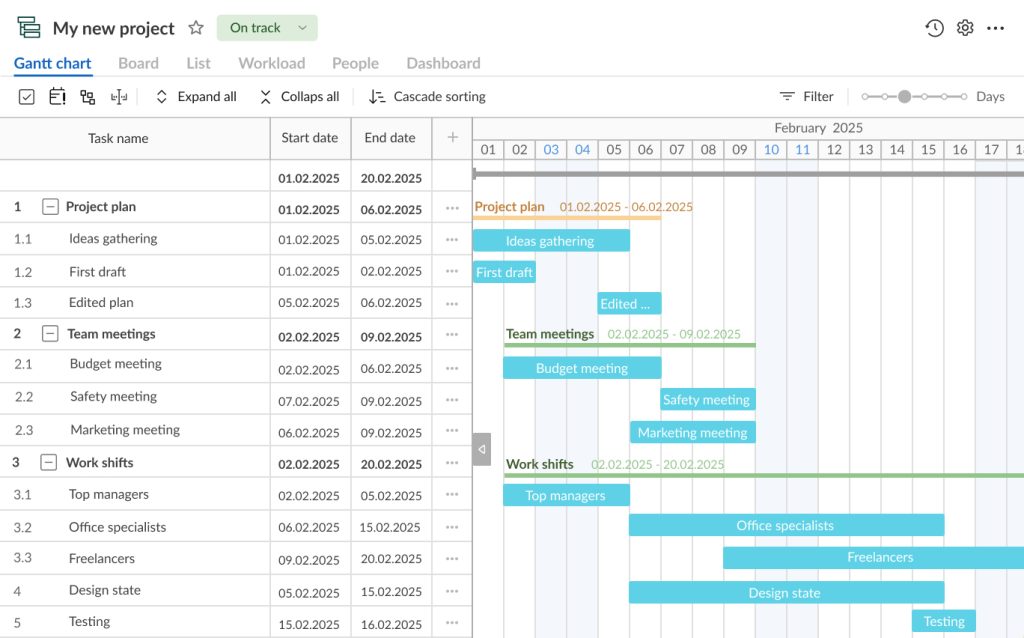
2. Divide your project into manageable tasks and subtasks
After creating a project, you can gather all your tasks and events and logically organize them. It’s easy to visualize start and end dates and add duration for each task.
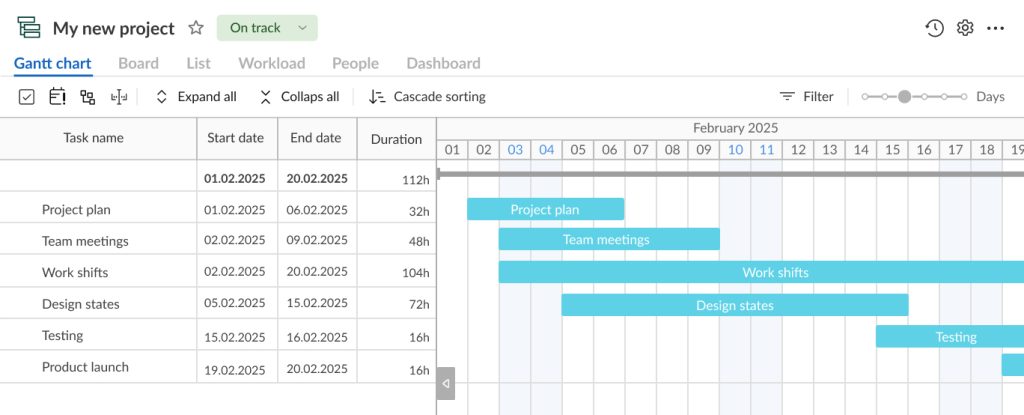
GanttPRO users can take advantage of a work breakdown structure.
It’s important to note here that this feature beneficially distinguishes the Gantt chart maker from PowerPoint and other similar tools.
With this structure, you can divide all functional parts of your project into smaller tasks and subtasks to keep things organized and maintain hierarchy.
In GanttPRO, you can also reflect the required fields next to each task title. If you need to hide irrelevant fields and replace them with more useful ones, you can do it in seconds.
For example, you can add a creation date, estimation, status, priority, assignees, and more, or create custom fields according to your specific requirements.
3. Involve team members and allocate resources
When your tasks and subtasks are logically visualized on a Gantt chart, it’s high time to invite responsible team members and organize all work assets.
GanttPRO allows you to visualize all the people who need to be involved in your project and add crucial resources to manage and complete work processes at any stage of a project lifecycle.
Invite and manage colleagues and virtual resources here, specifying their working time units, costs, and rights.

Effective Gantt chart software
Plan and manage projects easily with an online Gantt chart.
Sign up for free4. Assign tasks and balance workload
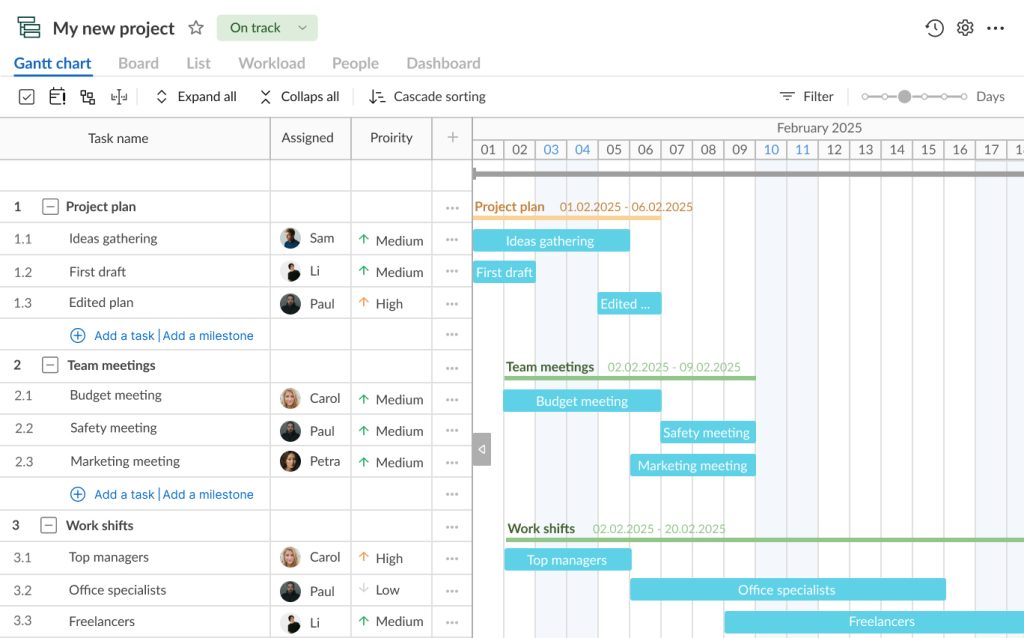
Assigning resources to specific tasks is another vital step that will help to make all your processes run smoothly.
Your project may need such assets as work crews, finances, materials, special equipment, vehicles, hardware, and more. All of them can be perfectly visualized in GantPRO without confusion and loss.
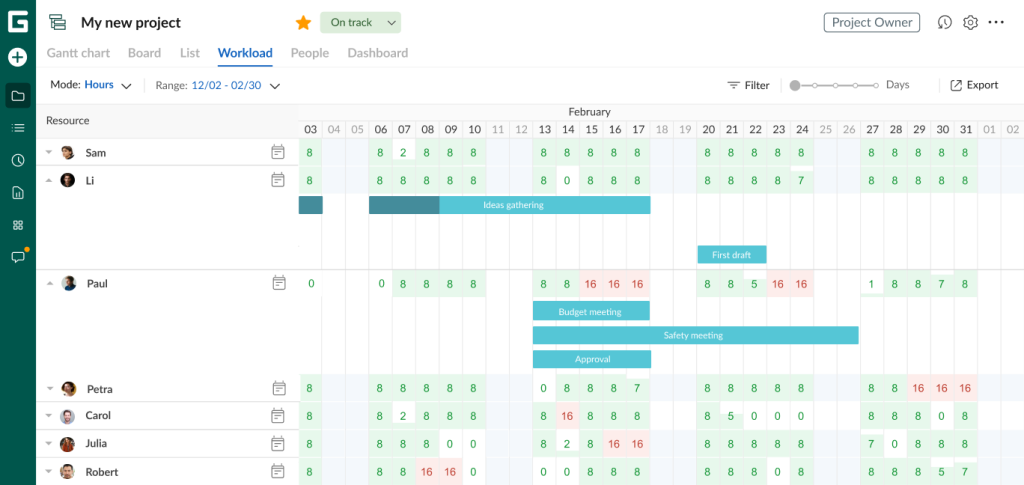
Another benefit of the Gantt chart maker is the workload control feature. With its help, you can see which members of your team are loaded with tasks, who are overloaded, and who, on the contrary, can get additional tasks or activities.
A special red human icon will appear to demonstrate if one of your colleagues is overloaded.
5. Add task dependencies and highlight milestones
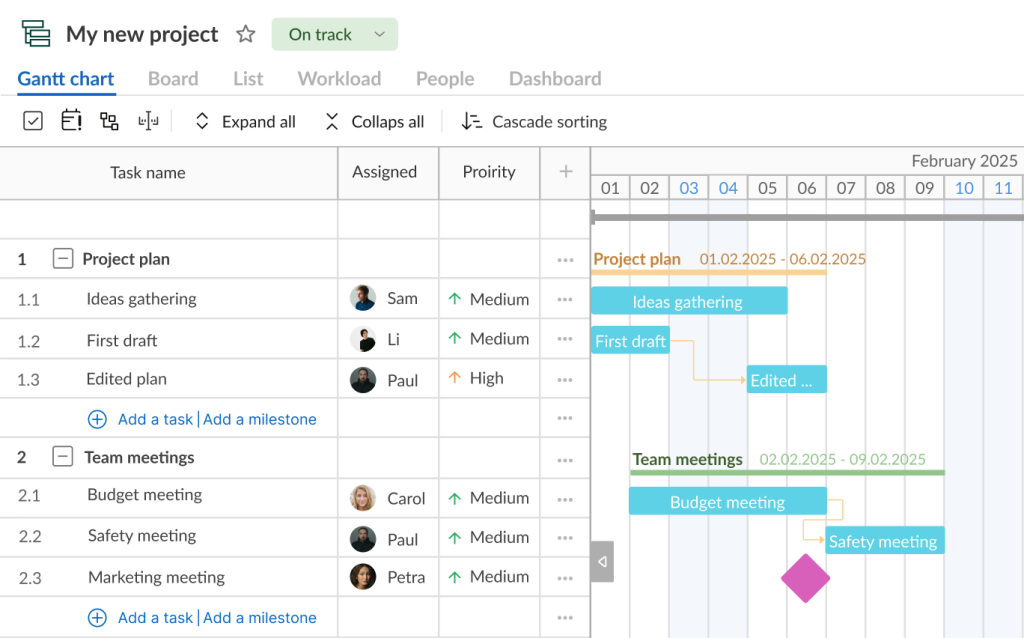
The capability to add and manage task dependencies is another significant advantage of using a GanttPRO timeline over PowerPoint.
With a user-friendly drag-and-drop feature, you can create clear relationships between tasks, ensuring a logical workflow and highlighting how changes in one task affect others.
For example, the completion date of one task can serve as the starting point for the next one, promoting a seamless progression of work.
In addition, GanttPRO allows for highlighting project milestones directly on a timeline to let you focus on key moments or major events. With these visual checkpoints, you’ll always stay on top of critical project goals and will never overlook core achievements.
6. Keep everyone informed by sharing your project timeline
Sharing your project timeline with stakeholders is the last but not the least step.
GanttPRO allows for creating one or more links to your project and sharing them with anyone you want.
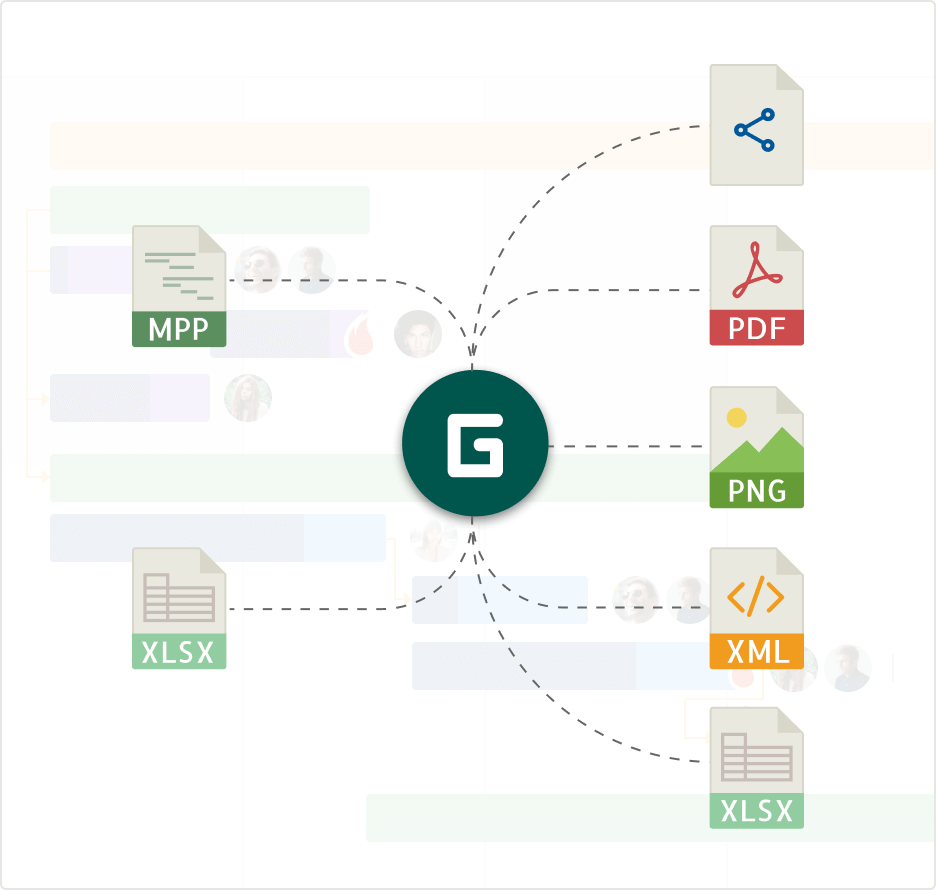
Export essential project data with ease in PDF, PNG, XLSX, or XML.
Each of the methods described above offers a unique yet effective approach. After exploring them, you should have a clear understanding of how to create a project timeline in PowerPoint and in a robust Gantt chart solution.
Here is a video overview.
Create a project timeline in PowerPoint or rely on GanttPRO and get more streamlined results
PowerPoint is widely recognized for its versatile tools and streamlined functionality, including options for creating project timelines. However, these options can sometimes seem complex and not intuitive for users.
If your project needs a more detailed and visually clear timeline that showcases tasks, dependencies, milestones, duration, and resources at a glance, GanttPRO is a tool worth exploring.
Whether you choose the Microsoft solution or a powerful Gantt chart tool like GanttPRO, a well-prepared project timeline will serve as your strategic ally, ensuring seamless workflows and improved team productivity.
Read also
Join 1M+ project managers!
Create Gantt charts in minutes with GanttPRO and reduce time spent on managing tasks by 40%
Try for freeNo credit cards required. No obligation.
