The History of Gantt Charts: From Henry Gantt to Modern Project Management
November 5, 2025 / Estimated reading time: 18 minutes

Audio version:
Modern projects can hardly be planned and controlled without a visual system containing tasks and dates. A Gantt chart is certainly one of the most reliable types of such systems.
Like the backgrounds of other fundamental project management tools, the Gantt chart history has its own milestones and roots with fascinating details. The diagram has seen ups and downs in the context of the project management evolution, but time and technical improvements have made it a powerful tool in the work arsenal of project teams.
If you seek comprehensive information about the historical evolution of a Gantt chart with key dates, facts, and vivid examples, you’re in the right place.
Let’s activate our virtual time machine and discover the journey of this incredible project management tool.
Contents:
- Historical preconditions: what inspired the creation of a Gantt chart?
- The birth of a Gantt сhart.
- Gantt chart evolution over time: expanding horizons & global impact.
- Historical examples of the Gantt chart usage.
- Gantt charts in modern project management & the impact of technology.
- Gantt charts are everywhere: the diversity of modern fields & areas that use them.
Historical preconditions: what inspired the creation of a Gantt chart?
The creation of a visual chart with horizontal bars was driven by specific preconditions and underlying reasons.
There is no concrete evidence that specific work planning and task control tools were used many years ago. However, it’s reasonable to assume that even ancient civilizations understood the importance of time management in their projects.
Imagine the construction of the Egyptian pyramids, the Great Wall of China, or the Roman aqueducts over 2000 years ago. These monumental achievements likely relied on some form of visual structures or manual planning instruments. None of these structures and tasks couldn’t be completed without thorough visual schedules.
All this suggests that people have always sought to plan and track their efforts and time in any work. That was the initial though not direct premise for the invention of a Gantt chart.
Now let’s move closer to the period of the diagram invention.
The late 19th and early 20th centuries were marked by significant industrial growth and transformation. The Industrial Revolution brought about complex machinery and factory systems, pushing businesses to optimize operations for maximum output and cost efficiency.
During that time, Frederick Winslow Taylor introduced the principles of scientific management. His theories focused on analyzing and optimizing workflows, standardizing tasks, and improving time management.
This era provided an ideal setting for developing tools to plan and monitor large-scale projects. And the mention of Frederick Taylor is not accidental because his scientific management principles significantly influenced the creation of a powerful diagram.
The birth of a Gantt chart
The invention of a Gantt chart is attributed to Henry L. Gantt, an American mechanical engineer and management consultant, who sought innovative ways to improve productivity and efficiency within industrial operations.
He designed a horizontal bar diagram that laid out project tasks against a timeline and subsequently published articles about his creation in 1910 and 1915.
His primary goal was to develop a visual tool that could simplify the planning and tracking of tasks within a project. He believed that visual representation could significantly enhance understanding and communication among team members, leading to better coordination and productivity.
However, there was a small historical confusion that made the Gantt chart history even more exciting. First of all, from a geographical point of view, because it involved the participation of residents from two different continents.
So, who was the second character in this story?
A similar diagram was actually introduced earlier, in 1896 by Karol Adamiecki, a Polish economist, engineer, and management researcher. However, Adamiecki shared his publications later, in 1909.
In 1931, he wrote a more widely recognized article where he described a chart, referring to it as a harmonogram.
Thus, a Gantt chart is named after an American engineer rather than a Polish one because Henry Gantt communicated and wrote his articles in English, whereas Karol Adamiecki published his works in Polish and Russian.

One of the core advantages of a Gantt chart was its ability to display interdependencies between work tasks. By visualizing horizontal bars to represent tasks and noting their start and end dates, the diagram efficiently reflected project schedules in a way that was easy to comprehend and analyze.
What about the first project in the Gantt chart history?
The first project planned and managed with a Gantt chart
The first notable project based on a Gantt chart was related to the management of armament production for the United States military. The US Army Ordnance Department adopted the diagram to optimize and monitor the production of munitions.
That complex project involved many contractors and suppliers who needed to be coordinated promptly, meeting all deadlines.
The implementation of a Gantt chart in this context was revolutionary. It provided a clear, visual representation of the project’s progress and potential bottlenecks, allowing managers to make informed decisions quickly.
Gantt chart evolution over time: expanding horizons & global impact
As a Gantt chart gained popularity, it continued to evolve and adapt to various industries and project management practices.
It competed with some other PM tools, such as a PERT chart. At the same time, it often complemented and was used together with other management techniques, such as the critical path method.
It wouldn’t be superfluous to emphasize the important role of the chart during World War I.
In military realities, the widespread introduction of the diagram received even greater impetus. It became critical in planning and executing tasks on a large scale with the need to plan and coordinate massive military projects.
Workers applied a Gantt chart to schedule production, allocate war assets, and track progress in building military equipment, infrastructure, and logistics. They provided commanders with a visual representation of complex operations and helped to oversee the timely completion of critical tasks. The diagram also assisted in planning and coordinating the various stages of construction, including digging, reinforcing, and camouflaging.
Luckily, the diagram didn’t become an exclusively military tool. It continued its development and moved to peaceful civil projects, some of which we’ll describe below. Those projects were truly global and useful. They undoubtedly strengthened the credibility of the diagram and made it even more popular.
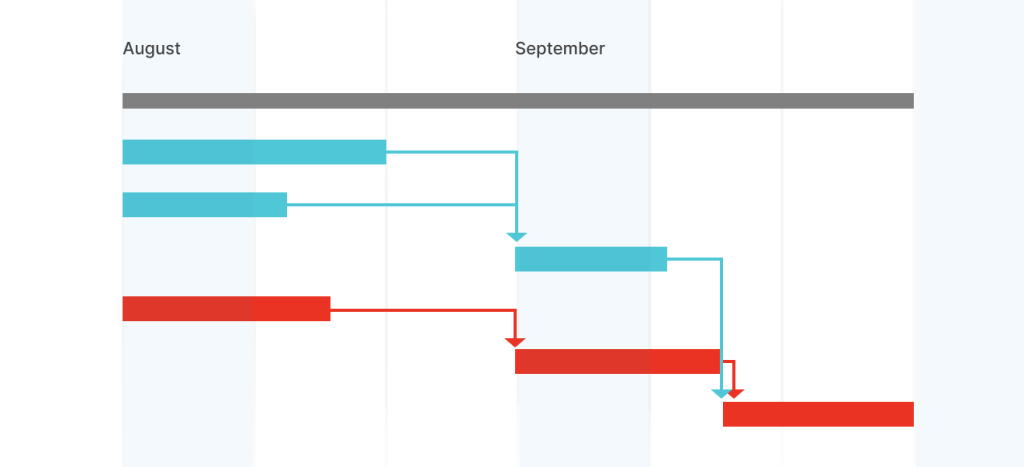
Before computers, Gantt charts were either drawn by hand as logically arranged bar charts or were created using a typewriter. They required manual revisions each time something changed.
A simple Gantt chart could look like in the picture below.
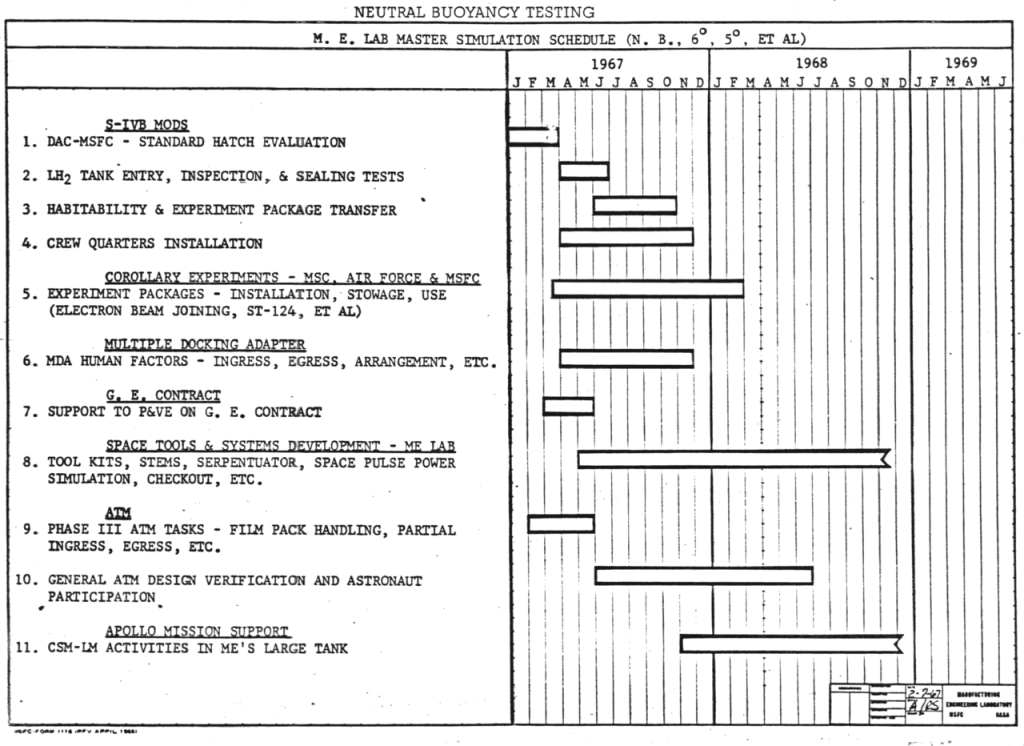
Such charts were subject to frequent changes. They had to be redone every time managers wanted to add, delete, or change something. It was a labor-intensive and complicated process.
By combining key dates and milestones in a Gantt chart history, you can logically visualize them within a single timeline.
Let’s take a look at it.
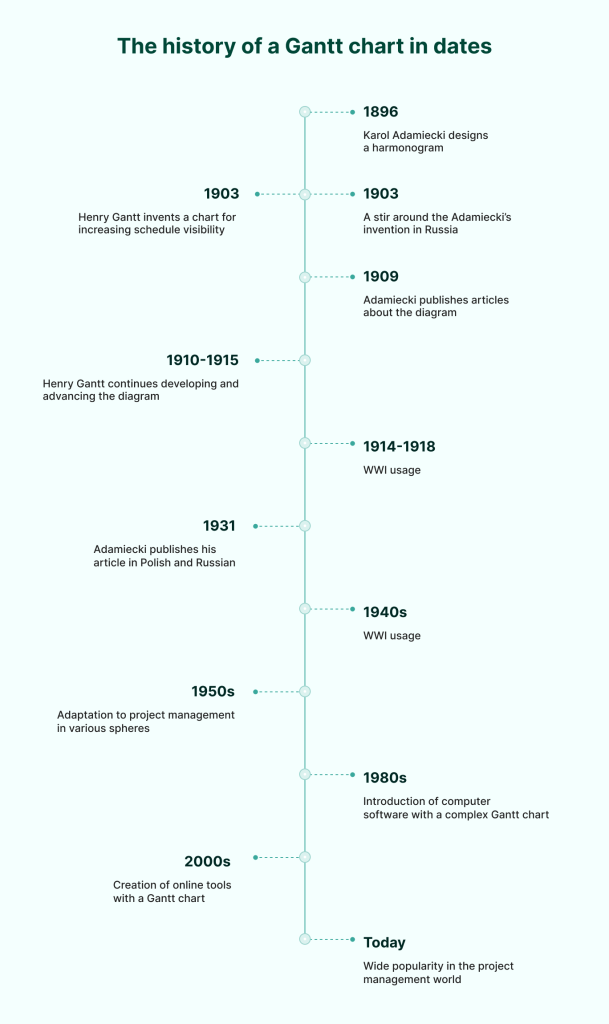
- 1896: Karol Adamiecki designs a means of displaying interdependent processes. He calls it a harmonogram.
- 1903: Henry Gantt defines a chart to increase the visibility of production schedules.
- 1903: the invention of Adamiecki causes a stir among representatives of the Russian technical community.
- 1909: Adamiecki publishes some articles in Polish describing the diagram.
- 1910-1915: Henry Gantt further develops the diagram, publishes articles describing them, and popularizes them.
- 1914-1918: a Gantt сhart is used to boost industrial production of munitions during WWI.
- 1931: Adamiecki publishes his more known article about the harmonogram in Polish and Russian.
- 1940s: a Gantt chart is extensively used during World War II for military project management and logistics.
- 1950s: a Gantt chart becomes a staple in project management, particularly in the construction and engineering industries.
- 1980s: the advent of personal computers and software makes creating and updating a Gantt chart more efficient.
- 2000s: online software solutions massively include the diagram into their feature sets. The rise of Gantt-based project management tools.
- Today: a Gantt chart is one of the most popular tools in project management. It is adapted to fit various project management frameworks, incorporating flexibility and iterative planning. Many AI-driven project management tools automate the creation and maintenance of a Gantt chart, streamlining project management efficiency.
As you see, many years ago and today, this chart is an important assistant for project teams that strive to achieve efficient work and private project results.
Now let’s look at some exciting historical cases where a Gantt chart became a robust tool for project management needs.
Historical examples of the Gantt chart usage
Many of you can simply build a Gantt chart on computers or even smartphones.
But what projects have been built and managed in the past using manual diagram visualization?
1. Hoover Dam: a Gantt chart for planning the ambitious project completed two years ahead of its schedule

The Hoover Dam project is known as one of the most ambitious construction projects of the 20th century. Its executors wanted to provide irrigation water, control floods, and generate hydroelectric power. This project, initiated during the Great Depression, was also focused on providing employment and stimulating the economy.
The construction site was located in the Black Canyon of the Colorado River. This massive endeavor required the coordination of numerous tasks, from diverting the river to building the dam itself and constructing associated infrastructure. It involved thousands of workers, engineers, and administrators, all of whom had to work in unison to ensure the project’s success.
The contract implied that the dam had to be completed within seven years, with heavy financial penalties for delays.
Such deadlines can be surely named as ambitious. To meet them, the project had to be thoroughly scheduled and controlled.
What role did a Gantt chart play in driving the successful outcome of this project?
Henry J. Kaiser, a key contractor on the project, applied a Gantt chart to manage complex schedules and resource allocation. In the context of this project, the diagram played a crucial role in organizing and visualizing various tasks and their timelines. It ensured that the project adhered to its stringent deadlines.
With the help of a Gantt chart, constructors visualized all project features and phases, including excavation, surveying, the construction of diversion tunnels, and the actual building of the dam. Each task was represented as a bar on the chart, with the length of the bar indicating the duration of the task. This visual representation allowed workers to see at a glance which tasks were underway, which were completed, and which were yet to begin.
The chart allowed responsible managers to allocate resources, anticipate bottlenecks, and adjust schedules as necessary.
The Hoover Dam was completed in 1936, two years ahead of schedule. It not only achieved its primary goals of flood control, irrigation, and power generation but also became a symbol of American ingenuity and determination. A Gantt chart, in turn, started to have a profound influence on the development of project management as a discipline.
2. Warsaw Central Station: a Gantt chart for managing complex reconstruction works

The global reconstruction of the Warsaw Central Station (Poland) between 1931 and 1939 was also a significant project that was realized with the assistance of a Gantt chart. The project involved many stakeholders including engineers, architects, government officials, construction workers, and suppliers.
The authors of this project chose the bar chart diagram to detail and visualize every phase of the construction process. They wanted all their tasks to be accounted for and managed in the most efficient manner.
They easily visualized such tasks as the demolition of the old station, new structures design, the installation of modern facilities, the integration of advanced railway systems, and much more.
All their tasks were reflected chronologically, representing the duration of each stage. Having this detailed project visualization, managers could easily allocate required assets, identify critical paths, and make changes.
The project had several key deadlines. Each of them contained its milestones and associated timelines, meticulously planned to avoid possible delays. The stringent deadlines reflected the high priority of the project and the necessity to minimize disruption to railway services.
The results of the project were impressive. The new Warsaw Central Station was a modern transportation hub that significantly improved railway services and passenger experience.
What role did a Gantt chart play in driving the successful outcome of this project?
A Gantt chart helped to facilitate coordination among all project participants by providing a shared reference that clearly communicated timelines and statuses. Such transparency and structure were crucial in managing such a large and complex undertaking.
The diagram demonstrated how visual scheduling and thorough tracking can ensure the timely completion of large-scale projects.
3. Boing B-29 Superfortress: a Gantt chart for planning all phases of the powerful bomber development

Another project that was planned and managed with a Gantt chart relates to the development of Boeing B-29 Superfortress (1940-1944). It is known as one of the most complex aircraft production programs of World War II.
The goal of the project was to create a powerful bomber capable of reaching Japan from bases in the Pacific. Its design was selected in 1940, and the company received the go-ahead to produce the prototype. The development of B-29 required substantial resources, coordination, and management due to its innovative design and the scale of production needed.
The timeline of this project spanned from 1940 to 1944, encompassing the design, testing, and mass production phases. It was vital to identify critical paths and ensure that activities crucial to the project’s success were prioritized and monitored thoroughly.
What role did a Gantt chart play in driving the successful outcome of this project?
Implementing a Gantt chart was essential for planning and managing this ambitious project. The diagram visualized the sequential and parallel tasks necessary to bring the B-29 from a concept to a fully operational aircraft.
Overall, the chart assisted in managing complex logistics and providing the required coordination between multiple stakeholders. By providing a clear visual representation of the project’s timeline and dependencies, it enabled effective communication across different teams and workers.
The project faced numerous challenges, including technical difficulties with the aircraft’s engines and several delays. Despite these setbacks, the project met its critical deadlines, largely due to the structured planning and oversight facilitated by a helpful Gantt chart.
This experience contributed to the broader adoption of the chart in various industries beyond aerospace, establishing it as a fundamental PM tool.
After reviewing the examples described, you may think that the Gantt chart history is full of cases only in large-scale construction or engineering projects.
This is true, but there were other projects related to manufacturing, promoting products to new markets, and even planning scientific expeditions.
Now is the time to move from historical examples to the modern period of Gantt chart use.
Gantt charts in modern project management & the impact of technology
No doubt, early-designed Gantt charts created on paper were not so effective. However, everything changed with the transition to software. As a Gantt diagram moved to digital platforms, it became easier to use.
One of the most important benefits of this transition was that team members had access to projects visualized on a Gantt chart in real time.
Nowadays, a Gantt chart has become one of the most effective tools in work management. Its adaptability allows it to easily fit into various project planning structures and practices, providing teams with extensive scheduling capabilities.
It is quite logical that teams of any size want to automate and improve their diagrams. As PM software evolved, a Gantt chart increasingly began to appear online as a fundamental feature of these platforms.
As Capterra’s Project Management Software Market Research report (2021) shows, 22% of users of software that doesn’t provide a Gantt chart, rank this feature as the most desired.

Professionals don’t need to manually create their visual bar charts from scratch anymore. The diagrams can be edited and used in conjunction with other project management tools and techniques to increase efficiency that Henry Gantt probably could not have imagined.
Convenient Gantt chart templates have gained a significant share of popularity as well.
In fact, modern project management tools that offer a Gantt chart can be hypothetically divided into two groups:
- PM general-practice tools, where a Gantt chart is just one of many features. Such a diagram is usually superficial and simple. It can be suitable for small teams and plain short-term projects without abundant task dependencies and many milestones.
- Advanced PM software based on a Gantt chart where this diagram is the core feature. Most often, this is a multifunctional chart that has many additional features for professional planning, resource allocation, team communication, and much more.
One of the best examples of comprehensive Gantt chart software is GanttPRO. It leads projects of any complexity to their successful completion and without headache.
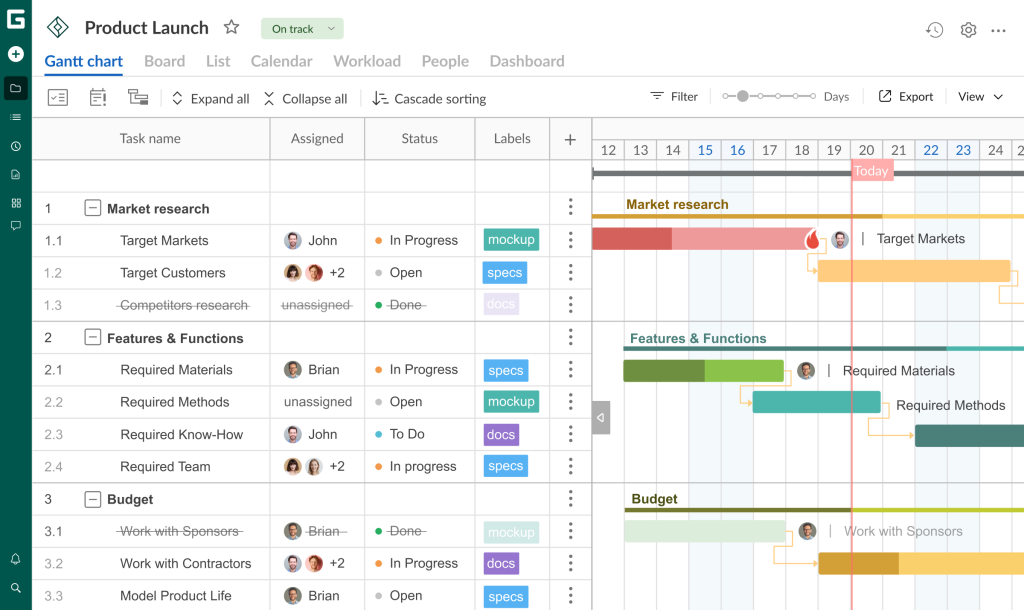
Along with a powerful Gantt chart, this software comes with many advanced project management features that allow teams to schedule, organize, and analyze their projects with ease.
GanttPRO provides the whole picture of a project workflow that is highly appreciated by in-office teams, remote employees, partners, and other stakeholders. The tool facilitates detailed task breakdown providing a handy WBS work breakdown structure and allows for visualizing dependencies, marking milestones, and specifying deadlines.
All this has made this tool a trustworthy solution among project management professionals worldwide.
Here’s how Rostislav Chernichenko, the head of Infrastructure & PM of the DevOps team at GeoComply, a company that provides compliance and anti-fraud solutions, describes his experience of work with a Gantt chart and GanttPRO:
I like the philosophy behind a Gantt chart. It allows for creating long-term, big, and complex projects. I have tried a bunch of products, mainly those that are based on Gantt charts. I haven’t been satisfied with lots of different things in them. Then I came across GanttPRO. And it perfectly hit the target. It is awesome!
Gantt charts are everywhere: the diversity of modern fields & areas that use them
If 20-30 years ago there were not so many available PM tools and methods, then the modern project management toolkit includes various solutions and techniques for many purposes.
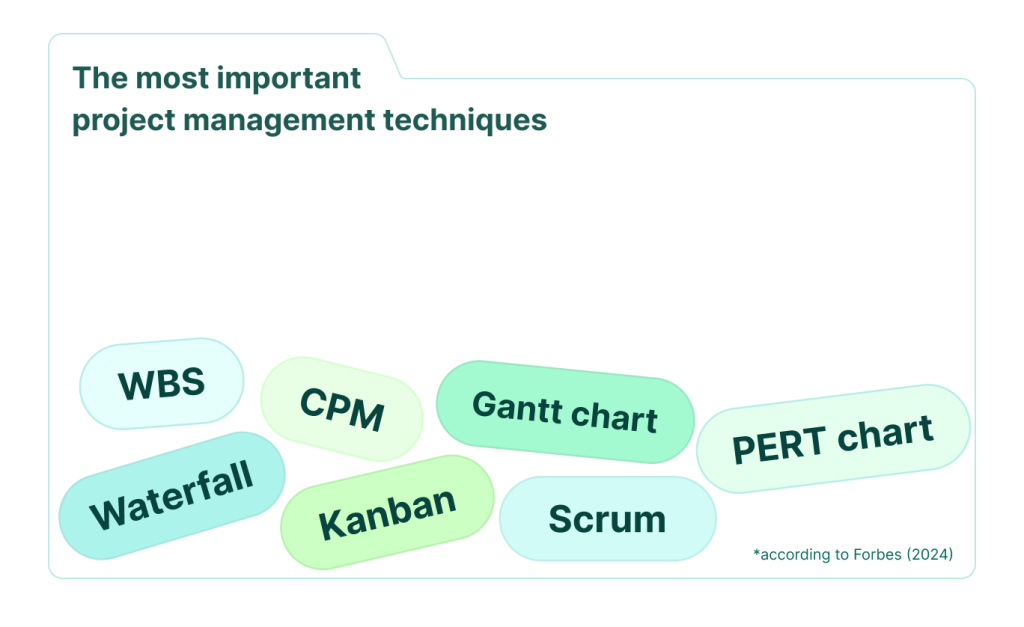
In fact, according to Forbes, a Gantt chart is included in the top 7 most important PM techniques in 2024.
A modern Gantt chart is widely used across various fields and industries to schedule projects, track progress, enhance communication, and ensure timely completion of tasks.
Here are the main areas where it’s commonly applied:
- IT and software development. A Gantt chart is used in software development to track the progress of coding, testing, and deployment activities. Agile and Waterfall development methodologies often incorporate this diagram to ensure that projects are delivered on time and meet quality standards.
- Construction. The diagram is essential in the construction industry. It is used for planning and scheduling various stages of construction projects on-site and in offices. It helps coordinate the activities of multiple contractors and subcontractors, ensuring that work is completed sequentially and without delays.
- Manufacturing. The chart empowers manufacturing processes, allowing for scheduling production runs, managing supply chain activities, and ensuring that products move efficiently through different stages of production.
- Event planning. This visual tool is frequently used in event planning to coordinate the various aspects of an event, such as venue preparation, vendor coordination, or entertainment efforts.
- Marketing campaigns. In marketing, a Gantt chart is used to plan and execute campaigns and manage timelines for content creation, ad placements, promotional activities, and more.
- Healthcare. People involved in this sphere apply the diagram to schedule patient treatments, coordinate care teams, and manage hospital resources.
- Education. Educational institutions use it to plan academic calendars, coordinate curriculum development, and manage research projects.
This list, of course, can be continued, because we have only indicated the most important areas.
Advanced project management with a Gantt chart
Plan and manage projects effectively. All in one place.
Sign up for freeWho can use a Gantt chart?
The primary users of Gantt charts are project managers.
According to the State of Project Management report by Wellingtone (2024), 47% of projects are mostly or always run by professional project managers.

However, this tool can be used by anyone leading a team or managing work, regardless of industry. It can also be applied for scheduling personal tasks and needs.
Below is the list of such users.
- Team leaders and supervisors: with a need to visualize project timelines, resource availability, and track work progress.
- Managers responsible for work schedules: with a need to schedule tasks, manage dependencies, and optimize resources.
- Executives: who want to see a high-level overview of project milestones to make informed decisions.
- Operations managers: who want to oversee multiple projects and prioritize work.
- Researchers and academics: with a need for a tool to help in planning research phases, data collection, analysis, and publication deadlines.
- Remote workers: who can benefit from a visual roadmap, making it easier to collaborate and see progress across different time zones.
- Government contractors: who manage complex contacts, ensure compliance, meet deadlines, and deliver quality results.
- Students: who organize study schedules and coursework deadlines, as well as plan research projects and dissertations.
Explore the Gantt chart history and use modern software to make projects as efficient as possible
For over a century, a horizontal bar diagram has reigned as one of the most effective tools for project management.
The incredible history of the Gantt chart is filled with notable facts and dates, which we have tried to describe above. Its invention was driven not only by the demand for greater industrial efficiency but also by the need to manage complex and large-scale projects with ease.
The use of a Gantt diagram extended beyond military application to various industries, including engineering, construction, manufacturing, and more.
Nowadays, you can easily apply powerful Gantt-based software solutions such as GanttPRO to enhance your work scheduling, task organization, resource allocation, and team communication.
Enjoy the power of a Gantt chart that remains one of the most demanded tools providing efficient functionality for displaying important information.
Read also

Join 1M+ project managers!
Create Gantt charts in minutes with GanttPRO and reduce time spent on managing tasks by 40%
Try for freeNo credit cards required. No obligation.