How to Accurately Analyze Progress, Budget, and Time on Tasks with GanttPRO: Graphical Reports
June 17, 2025 / Estimated reading time: 4 minutes

This release includes an updated Reports section with the new graphical ways of visualization.
With them, you’ll be able to more flexibly and accurately track and analyze your progress, budget, and time spent on tasks in one as well as multiple projects and even portfolios – graphically, all in one place.
Let’s get right into it.
What reports are available
First, let’s figure out why you may need these graphical reports in GanttPRO online Gantt chart software.
They will help you:
- Better understand what is going on in your projects.
- Identify deviations and possible risks faster.
- Establish clear and transparent communication and collaboration with third parties such as stakeholders, clients, etc.
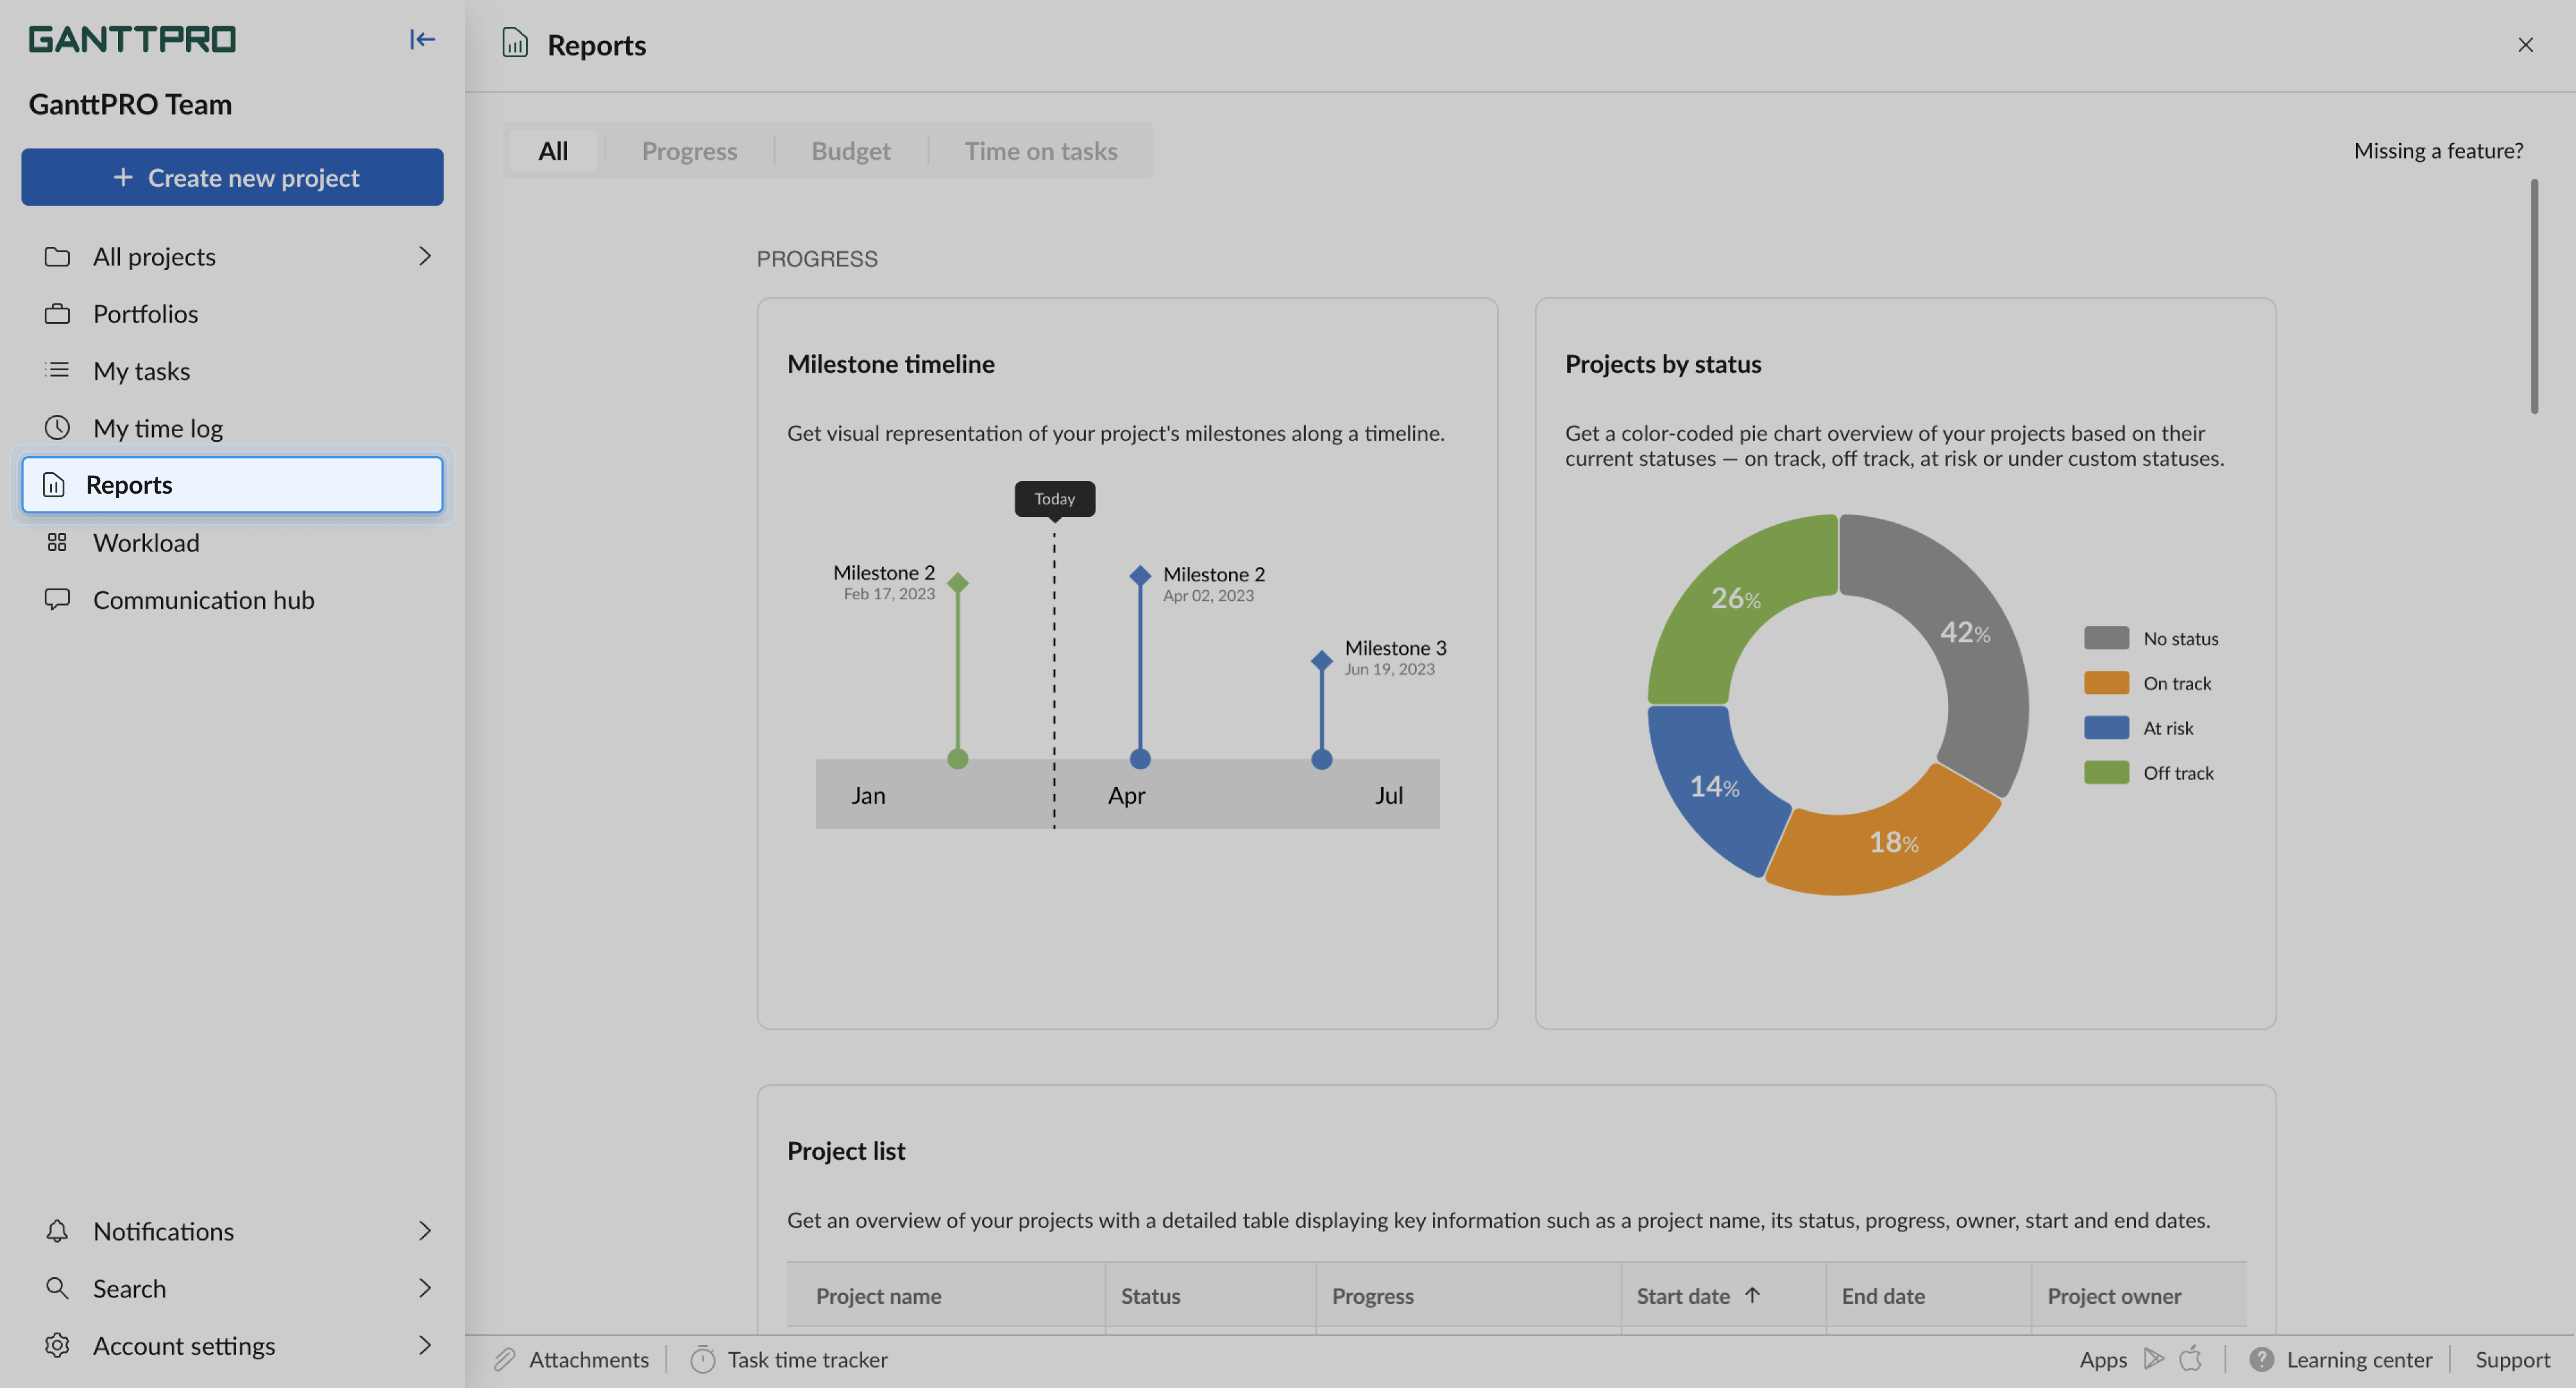
You’ll find all reports in the same Reports section in the left sidebar.
In addition to the two types, Time log and Budget analysis, that were previously available we’ve added 9 more.
All of these reports fall into 3 general categories:
- Progress.
- Budget.
- Time on tasks.
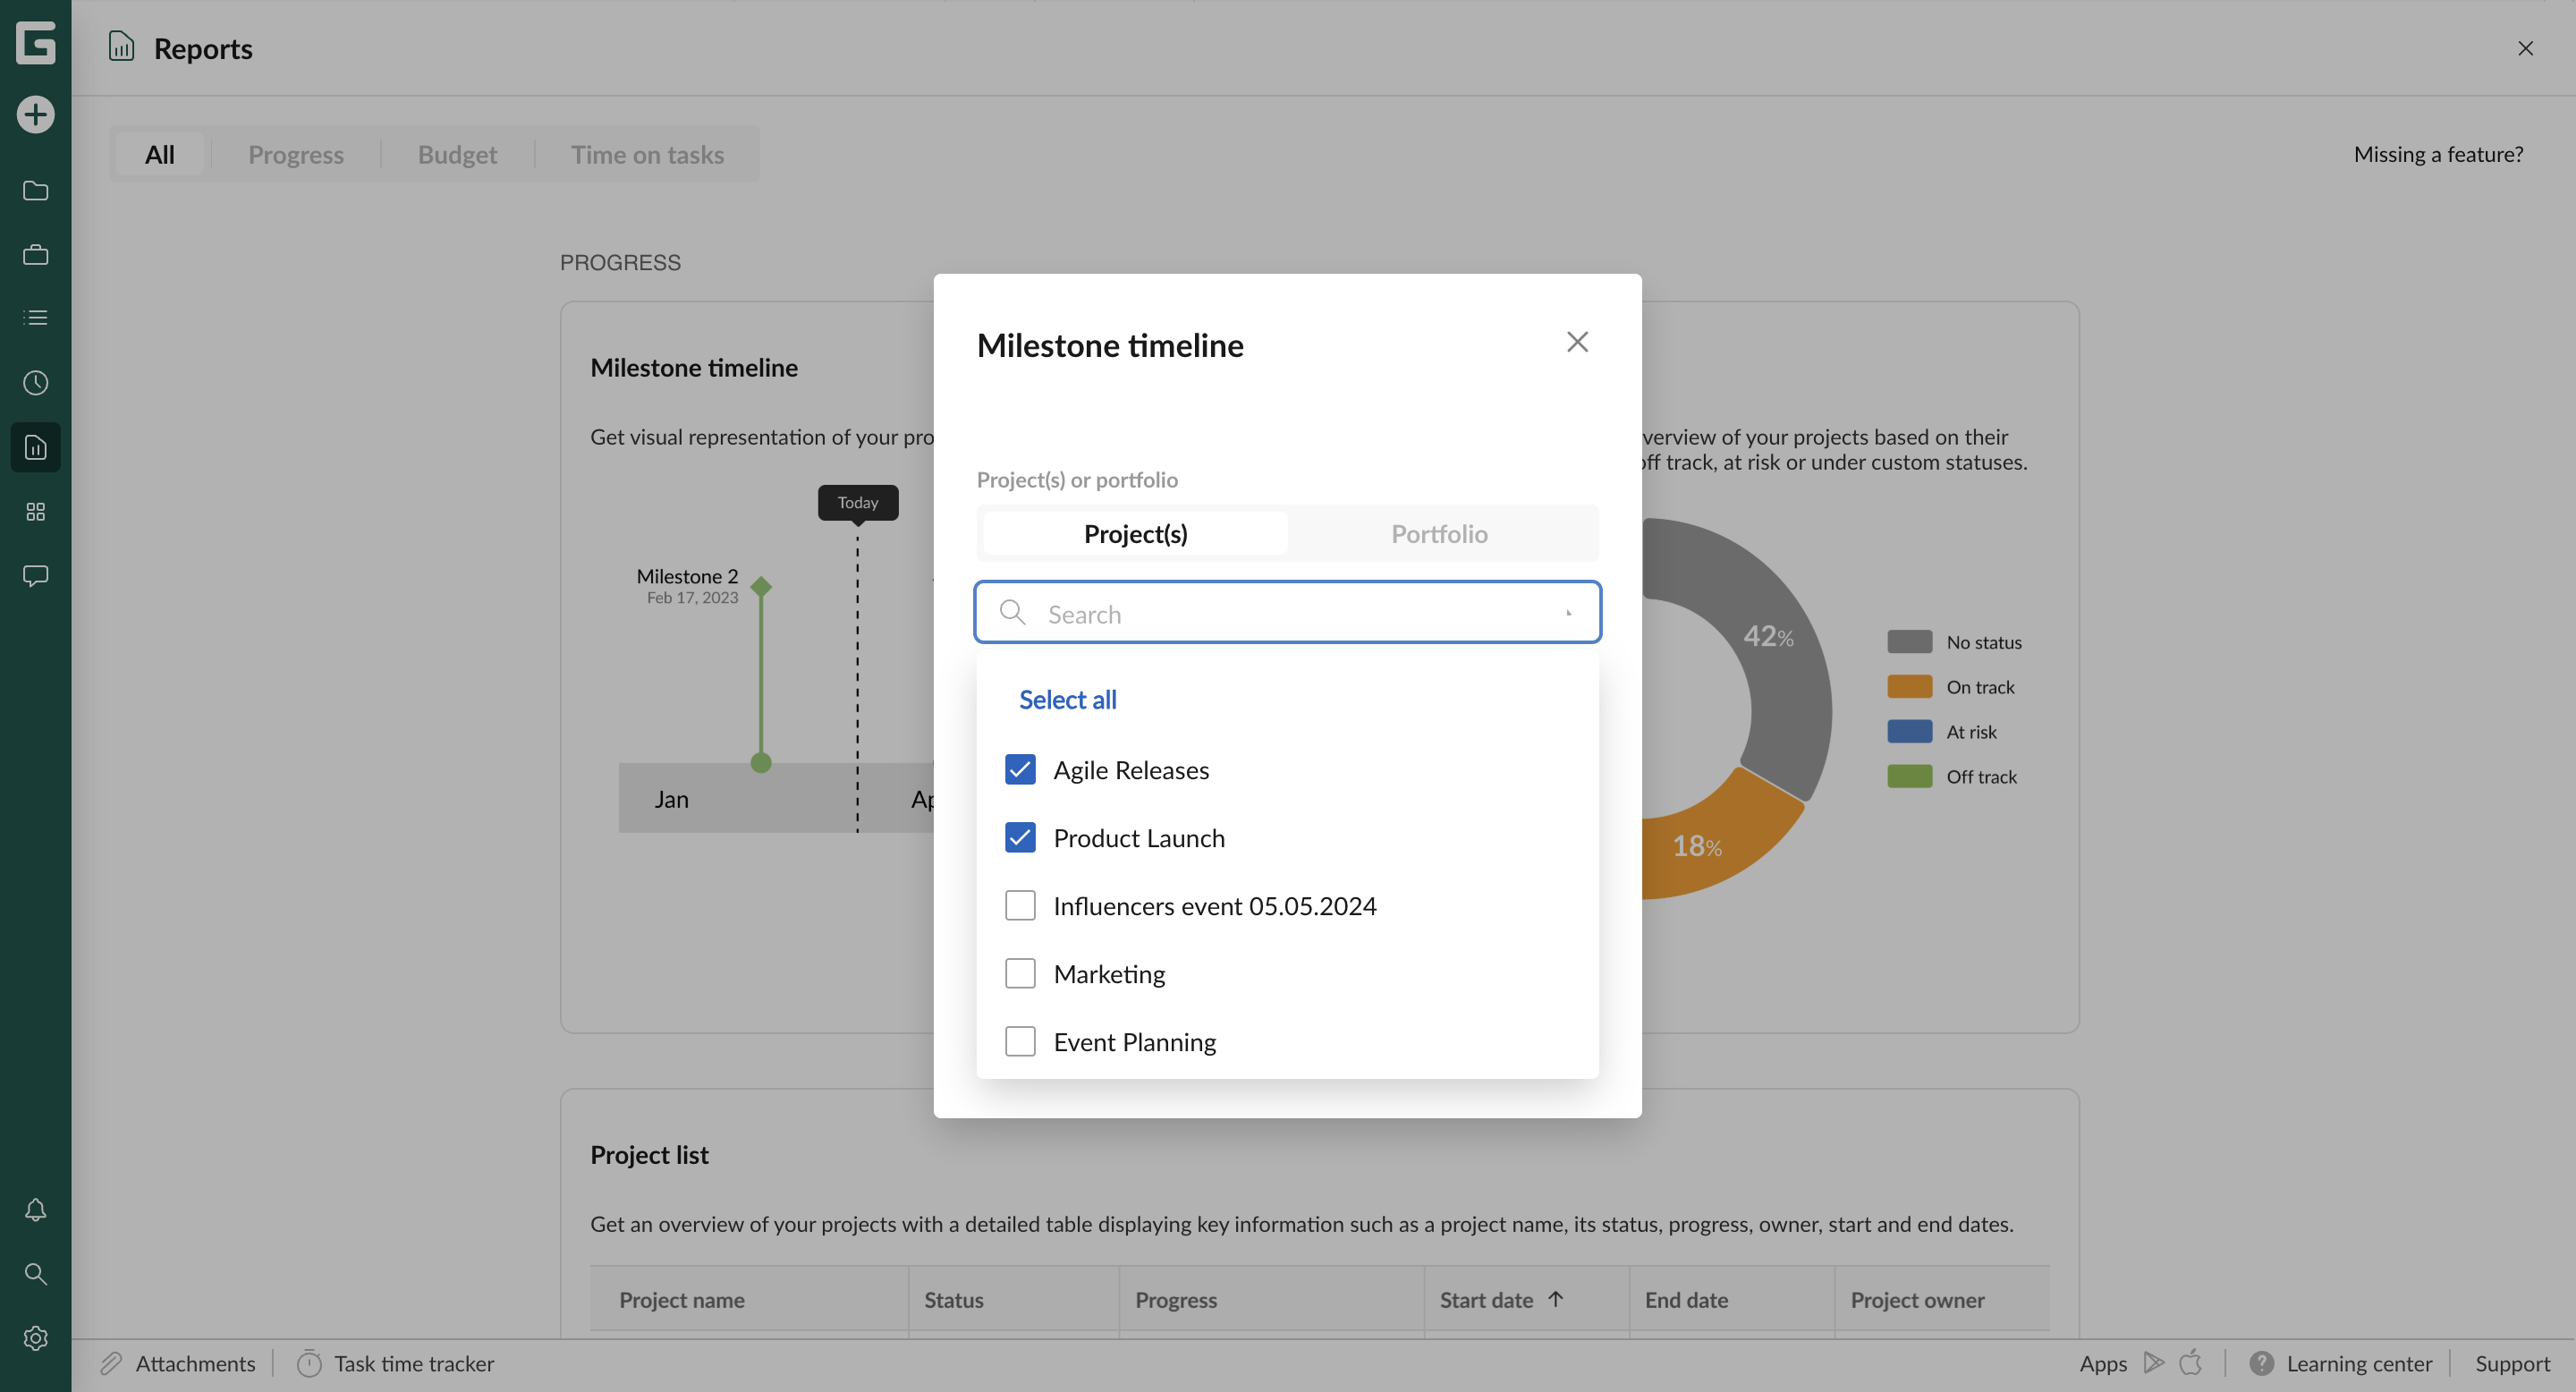
To create one, simply select the type you want and click Create. A pop-up window will appear where you can select the options you want to include in your report.
Now, let’s go through each new report.
Progress reports
Here, you will find 5 new reports:
- Milestone timeline.
- Projects by status.
- Project list.
- Schedule variance.
- Progress S-Curve.
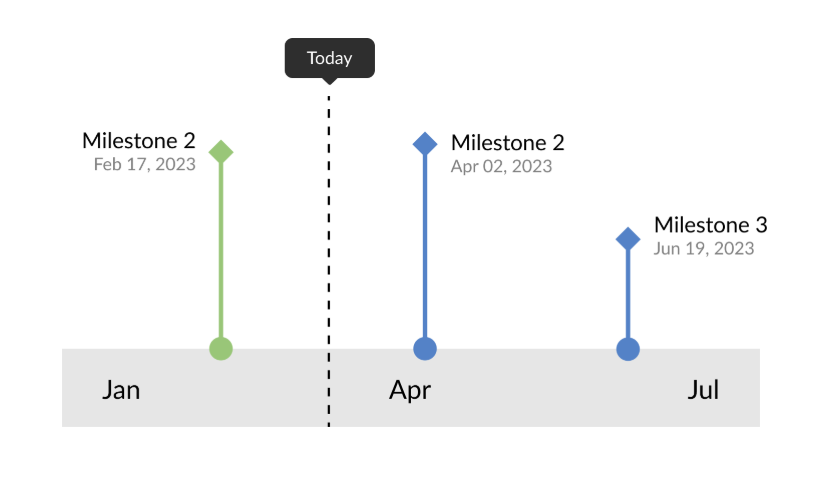
Milestone timeline
This report will give you visual representation of your project’s milestones along a timeline that shows events by month.
You can include here one or several projects as well as portfolios.
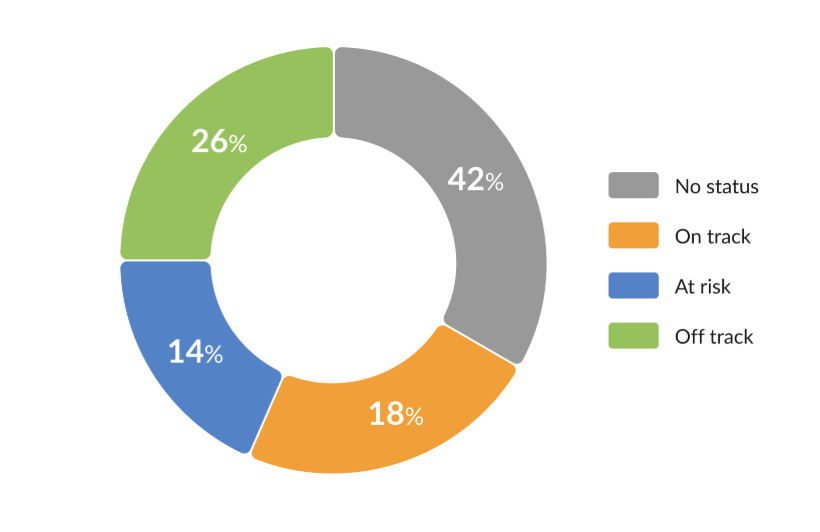
Projects by status
This report will give you a color-coded pie chart overview of your projects based on their current statuses — on track, off track, at risk or under custom statuses.
You can include here one or several projects as well as portfolios.
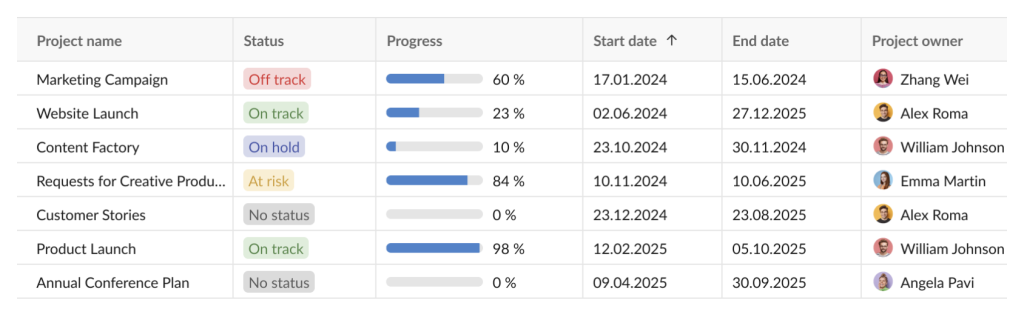
Project list
This report will give you an overview of your projects. It will include a detailed table with key information such as a project name, its status, progress, owner, start and end dates.
You can include here one or several projects as well as portfolios.
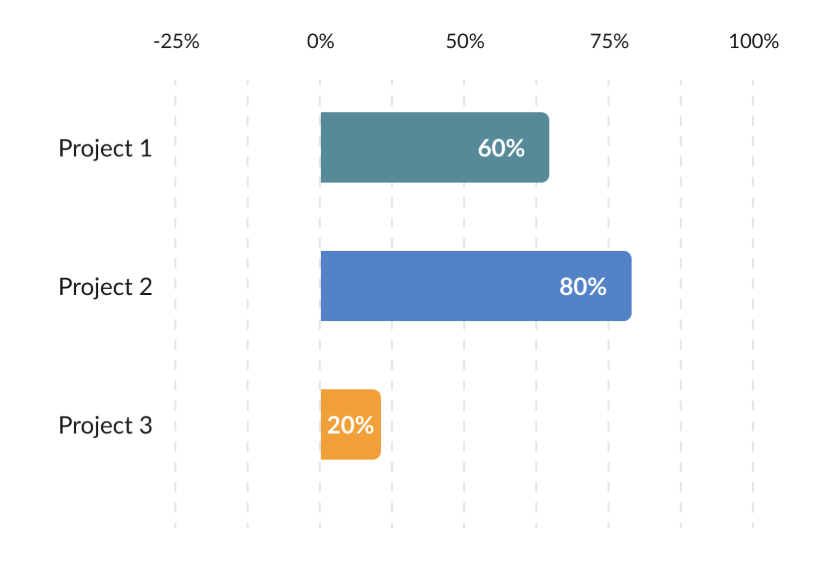
Schedule variance
With the help of this report, you will understand whether project schedules are on track or running ahead/behind.
You can include here one or several projects as well as portfolios. Also, you can select a calculation mode: for multiple projects – Actual to planned; for one project – Actual to baseline or Planned to baseline.
If you see a negative value, it means that your project is behind schedule.
If you see a positive value, rest assured that your project is ahead of schedule.
Please note that all progress values are taken as of the current date.
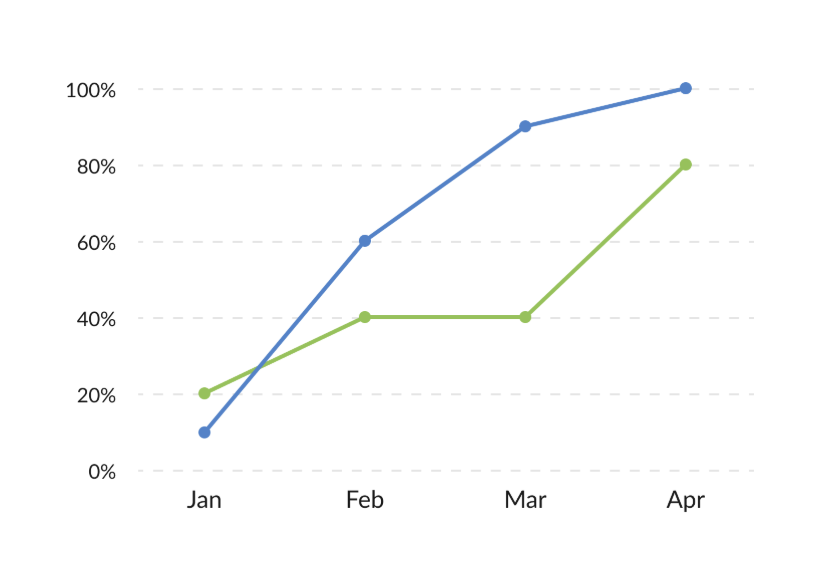
Progress S-Curve
This report will help you track project cumulative actual and planned progress. In other words, you will see whether your project is on track or not.
You can include here just one project. Also, you can select a calculation mode: Actual to planned, Actual to baseline, or Planned to baseline.
Budget reports
Here, you will find 2 new reports:
- Budget analysis by project.
- Budget S-Curve.
The Budget analysis report remains the same.
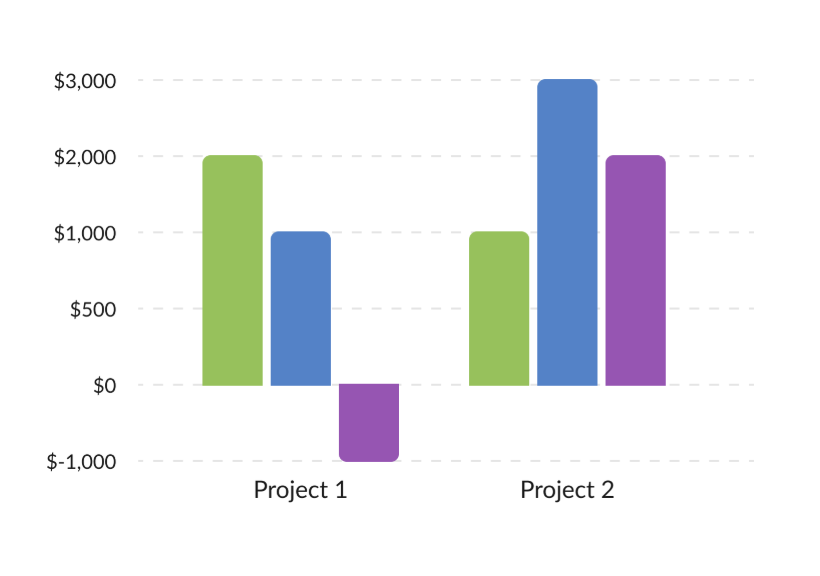
Budget analysis by project
With the help of this report, you will be able to track cost variance by each project to ensure that you stay on budget and avoid overspending.
Note: the table version of this report is in development.
You can include here one or several projects as well as portfolios. In addition, you can select a calculation mode depending on how many projects you have: for multiple projects – Actual to planned; for one project – Actual to baseline or Planned to baseline.
Budget S-Curve
With this report, you’ll be able to track your project’s cumulative budget and actual cost. In other words, it shows your planned budget, real spendings, and the deviation from the planned budget.
It combines two types of visualization:
- S-Curves. They show cumulative values for each month.
- Bars. They show point values for each month.
Only one project is available for inclusion here. Also, you can select a calculation mode: Actual to planned, Actual to baseline, or Planned to baseline.

Time on tasks reports
Here, you will find 2 new reports:
- Time on tasks analysis by project.
- Time on tasks S-Curve.
The Time log report remains the same.
Time on tasks analysis by project
This report will help you track variance in working hours by each project. In other words, it shows the planned and spent time on tasks, as well as the variance between these values.
Note: the table version of this report is in development.
One and several projects as well as portfolios are available for inclusion here. Also, you can select a calculation mode depending on how many projects you have: for multiple projects – Actual to planned; for one project – Actual to baseline or Planned to baseline.

Time on task S-Curve
With this report, you’ll be able to track project cumulative time logged and estimated hours.
It combines two types of visualization:
- S-Curves. They show cumulative values.
- Bars. They show values for each month.
You can include here just one project. Also, you can select a calculation mode: Actual to planned, Actual to baseline, or Planned to baseline.

Need help?
If you have questions about how to work with new reports, ask us in the Live chat.