22 Free and Open Source Data Visualization Tools to Grow Your Business

What’s the power of data visualizations?
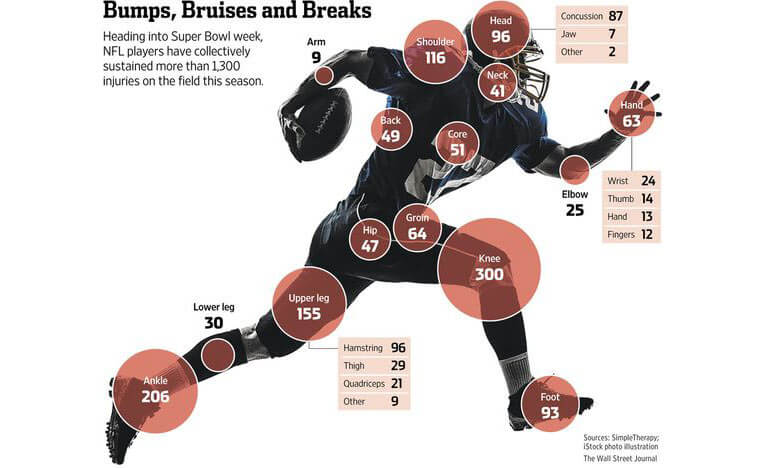
Well, I could tell you that professional football players suffer a lot of injuries, and that those injuries, of course, occur in different percentages based on body parts. I could spend a whole paragraph yakking about body parts, freak accidents, and what a violent game football is.
Or, I could just show you this.
I’m willing to bet this sentence is the first one a lot of you are reading. That’s because your eye went straight for the visualization. But this graph doesn’t just catch your eye, it tells a story in a very subtle way. Juxtaposed with the facts about injuries, the caption about “heading into Super Bowl Week,” along with the player’s forward motion, suggests the ways injuries result from action, but result in inaction. The facts about injuries, mentioned over each body part, suggest the fragility that comes from 250 lb. men smashing into each other for three hours each week.
