


A Gantt chart is a great tool for task management, project planning, scheduling, and progress tracking.
In case you have questions about these diagrams, here is the complete guide to Gantt charts that covers most of them.
- What is a Gantt chart?
- The history of a Gantt chart.
- What is a Gantt chart used for?
- What information is included in a Gantt chart?
- Example of a Gantt chart.
- How to create a Gantt chart?
- Advantages and disadvantages of a Gantt chart.
- Where to use a Gantt chart?
- What is a Gantt chart template?
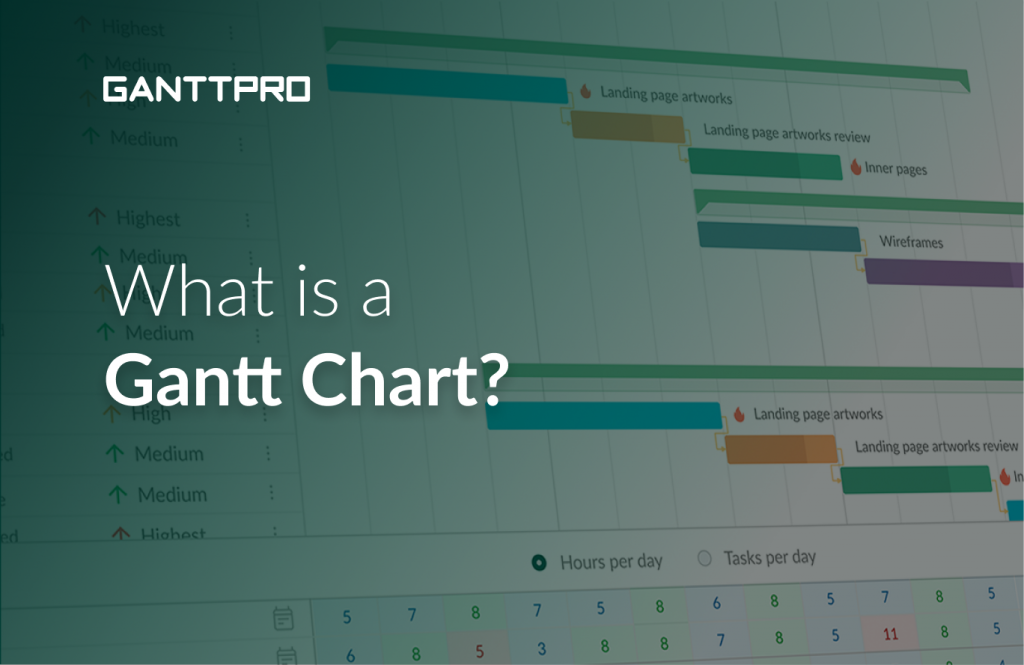
What is a Gantt chart and why is it important?
A Gantt chart is a bar chart with two axes – a horizontal one and a vertical one. The first one is used to define start and end dates while the latter is used to present tasks.
This diagram shows all your assignments and their dates along a timeline. In other words, it is a clear visually appealing schedule of your and your team tasks and dates that can be connected to each other.

As you see, with a Gantt chart, you will know what work has to be done, current work as well as what has already been accomplished. It also helps keep track of the progress of your plan or project and be aware of all the deadlines in advance.
By the way, Forbes named a Gantt chart among the seven most important project management techniques in 2024.
The history of a Gantt chart
The Gantt chart history has its own important milestones and interesting dates.
The “Gantt” in this expression stands for the last name of its creator – Henry Gantt, an American mechanical engineer, and management consultant. He designed a diagram and further published articles about his invention in 1910 and 1915. At that time, those charts were completely novel.
Surprisingly, but a diagram itself was introduced even earlier, in 1896, by Karol Adamiecki, a Polish economist, engineer, and management researcher. However, he only managed to publish his first work in 1909. Later on, in 1931, he published a more widely known article where he described the harmonogram – he called the chart like this.
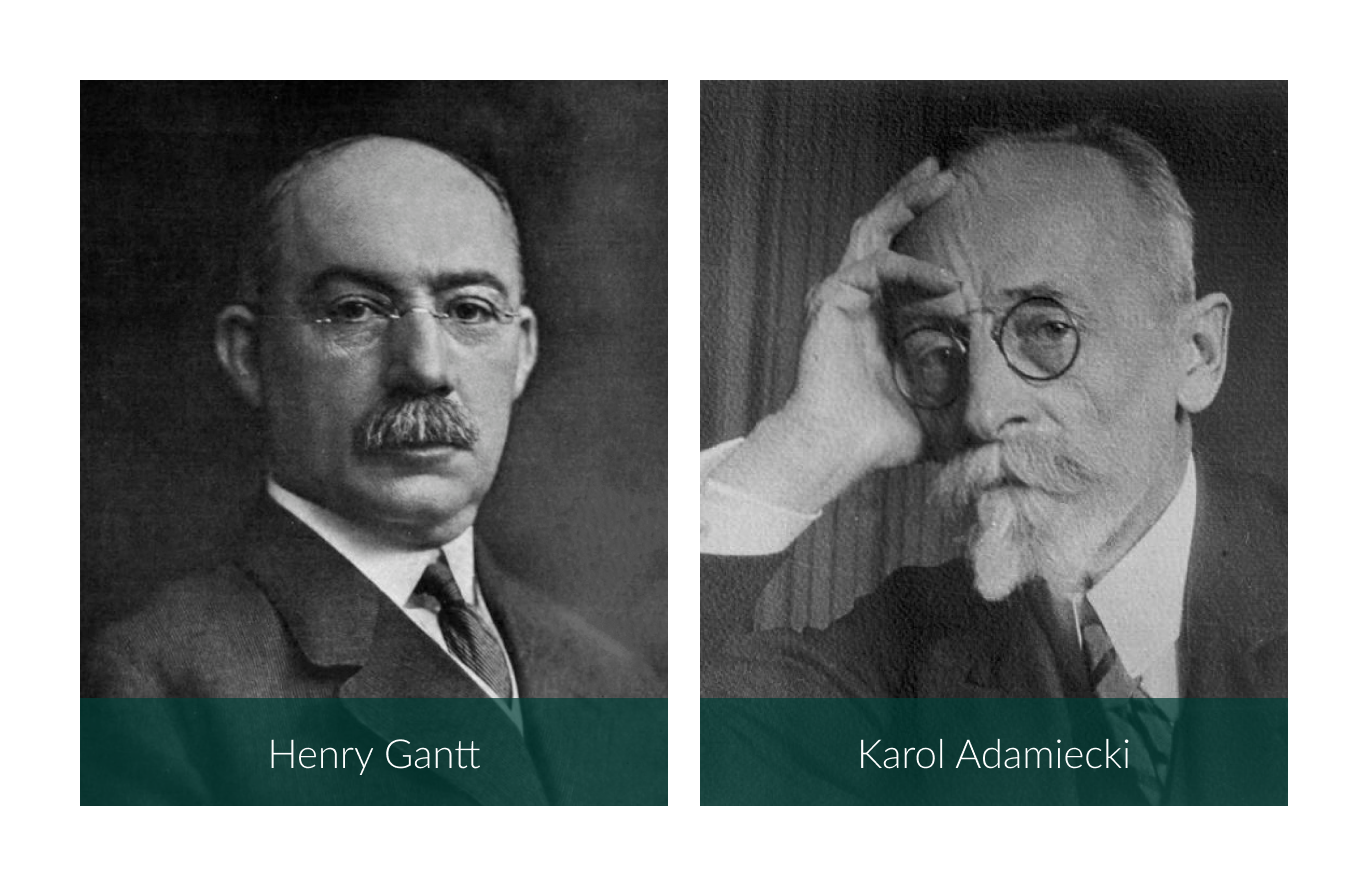

The reason why the Gantt chart is named after the American engineer and not the Polish one is quite obvious. Henry Gantt spoke and wrote in English, while Karol Adamiecki published his articles in Polish and Russian.
The history of a Gantt chart in a few dates:

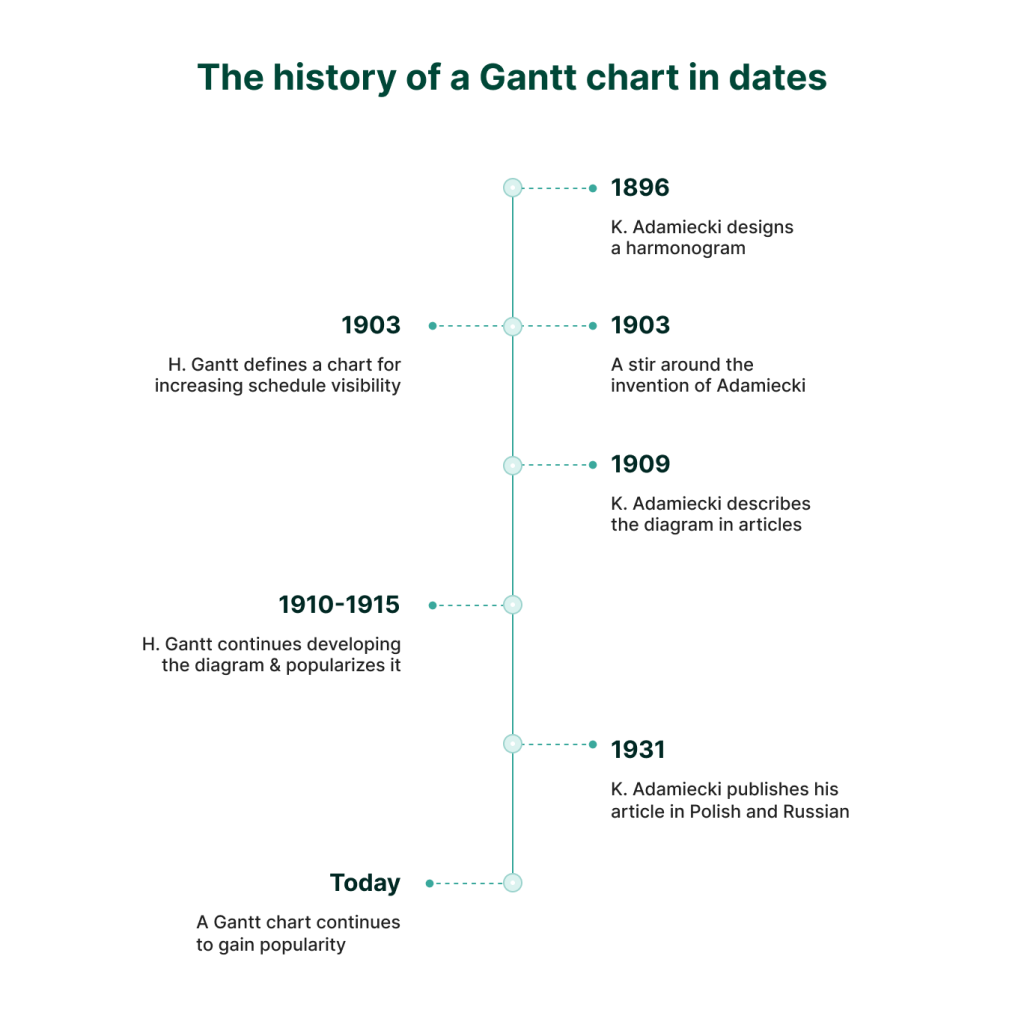
- 1896: Karol Adamiecki designs a means of displaying interdependent processes. He calls it a harmonogram.
- 1903: Henry Gantt defines a chart to increase the visibility of production schedules.
- 1903: Adamiecki’s invention causes a stir in technical circles in Russia.
- 1909: Adamiecki publishes some articles in Polish describing the diagram.
- 1910-1915: Henry Gantt further develops the diagram, publishes articles describing them, and popularizes them.
- 1931: Adamiecki publishes his more known article about the harmonogram in Polish and Russian.
- Today: a Gantt chart is one of the most popular tools in project management.
What is a Gantt chart used for?
A Gantt chart is used to cover several project management issues. However, one of them is fundamental.
With its help, you can easily schedule every phase of a plan regardless of its duration with clearly defined start and end dates.
In addition, a Gantt chart helps identify milestones – significant events in your projects with no duration – and deadlines. Don’t want to miss a date? The Gantt diagram is your solution!
With the advance of online Gantt chart tool, the chart becomes a handler in other situations. In particular, it helps manage resources, cost, and collaborate between team members.
Put it shortly, a Gantt chart is used for:
- Task scheduling.
- Identifying milestones.
- Keeping track of deadlines.
- Keeping track of progress.
- Connecting tasks with dependencies.
- Collaboration.
- Resource management.
- Cost management.
What information is included in a Gantt chart?
A typical Gantt chart should include the following information:
- Tasks, their duration, status, and priority.
- Start and end dates.
- Progress.
- Timeline with the time scale.
- Milestones.
- Dependencies between tasks.
- Deadlines.
- Critical path.
A robust Gantt chart tool that is able to cover most of the needs of project managers will also include:
- Assignees.
- Estimations.
- Resource workload: who works on what tasks, who is overloaded, who can be given more tasks.
- Costs.
- Options that allow customizing plans.
- Comments, attachments, notifications for teamwork.
- Baselines.
- Templates.
- Auto scheduling.
So, if you need an answer to the question “What are the main features of a Gantt chart?”, just look above – these features help build solid projects and organize all the teamwork.
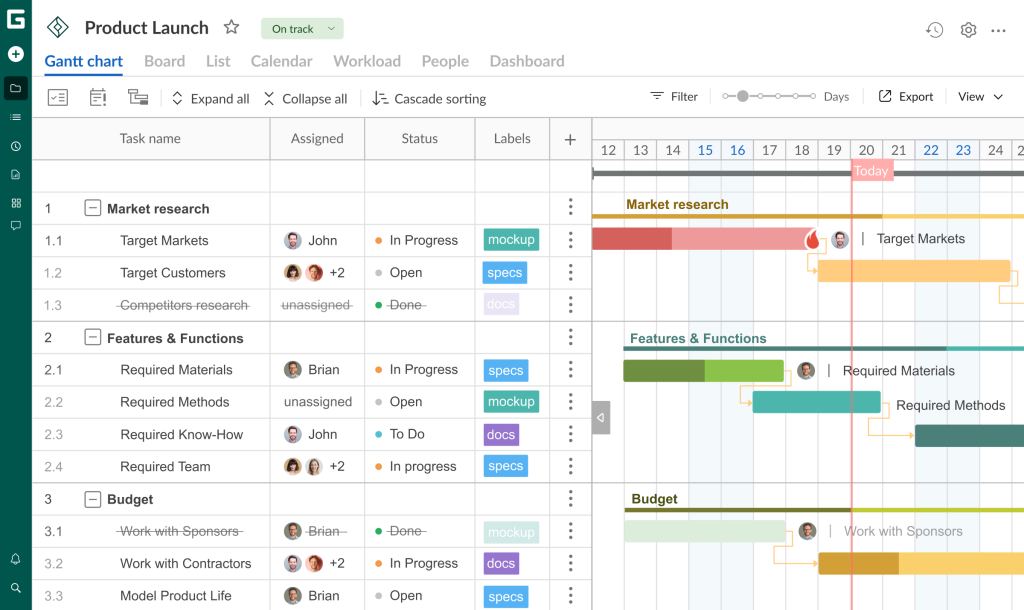
Example of a Gantt chart
Here is how GanttPRO online Gantt chart maker – one of the most robust and intuitive tools in the market and a perfect example of the diagram – looks like.

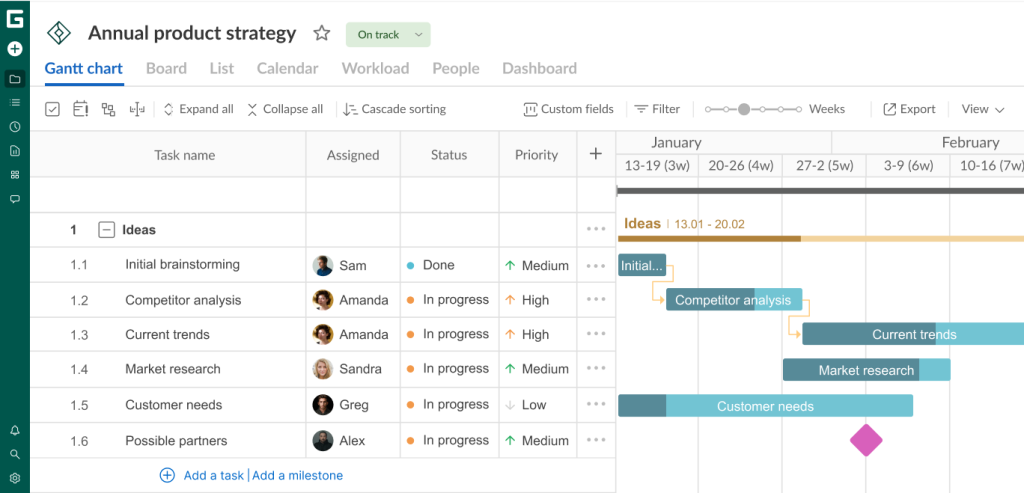
In GanttPRO as well as in some other tools you will find lots of Gantt chart examples for different spheres.
Here is what Adam Hirsk, the head of product and R&D at Pacvac, a manufacturer of backpack vacuum cleaners (Australia) thinks about the software:


We tried top recommended 5-6 Gantt chart planners and GanttPRO was the one that seemed the most intuitive with good UI, which is the main reason I selected it. I also liked the custom columns feature, this actually makes a big difference when compared to other solutions.
How to create a Gantt chart?
Fortunately, this is not even a point to consider when you build a project because modern solutions make this process easy and enjoyable.
Of course, applications differ and range from hard-to-manage solutions to intuitive software with easy-to-understand UX/UI design.
It is simple unless you take not designed for Gantt chart building solutions. Like Excel. Or powerful but not modern like MS Project.
In general, you need to follow four simple steps in order to create a Gantt chart:
- Add tasks.
- Define dates for tasks and the whole calendar.
- Connect tasks with dependencies.
- Assign tasks.
Can I make a Gantt chart in Excel?
Unfortunately, you can. Why unfortunately? Because Excel was not designed for creating Gantt charts, especially dynamic ones.
In case you have time and desire to do it, here is a guide on how to make a Gantt chart in Excel.

How to create a Gantt chart in MS Project
MS Project allows working with Gantt charts and offers hundreds of features. However, this tool is too complicated and requires too much time to learn it.
From this MS Project tutorial, you can learn basic instructions, particularly, on how to make a Gantt chart in MS Project.

How to create a Gantt chart in PowerPoint
Moreover, you can make a diagram even in some unexpected tools. One more Microsoft product can do that too.
So, if you are up to it, you can discover how to create a Gantt chart in PowerPoint.

How to use a Gantt chart?
It is very easy to use a Gantt chart as a diagram itself is simple to read yet it is very powerful. Do not be surprised but:
In case you decided to create one in online software (it is 21-st century and I won’t expect anyone to make it in any other way), it largely depends on a tool you’ve chosen. Anyway, it is as simple as ABC.
Why is it simple to use a Gantt chart?
This bar chart is the perfect way to visualize tasks, milestones, and dates, as well as connect tasks with dependencies. Also, it easily allows following deadlines of your project.
You see: a Gantt chart shows the most crucial elements of a project. And it is very easy to use it in project management.
When to use a Gantt chart
Use it when you need to plan any event both personal and team: preparation for an exam, apartment renovation, wedding preparation, house building, in marketing campaign and software development, and much more. If you have tasks with certain timeframes and goals to achieve – meet a Gantt chart.
Advantages and disadvantages of a Gantt chart
It is highly likely that now you think something like “Wow, what a great tool it is! Aren’t there any disadvantages?”
As anything in our world, a Gantt chart is reviewed from different perspectives.
What are the advantages of a Gantt chart?
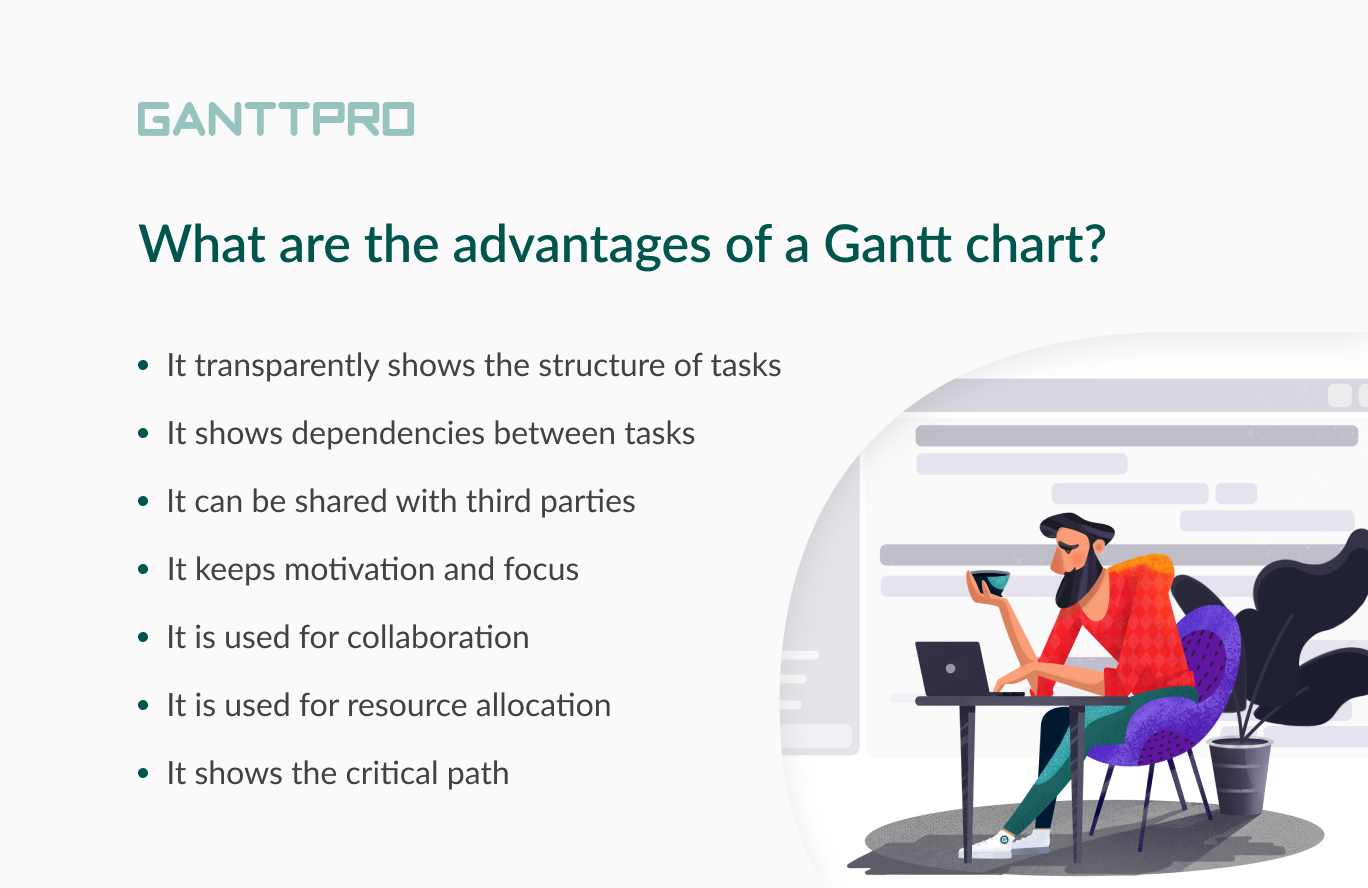
- It is transparent, clear, and structured
Imagine that you need to promote your brand to increase sales volume. You will probably be scared from the very beginning as it is difficult to define where to start and how to measure deliverables.
A Gantt chart allows breaking down projects into smaller pieces that can take from a few hours to a few days. The more you chunk, the higher the chances are to complete a project as each task is clearly defined. This is a critical advantage of a Gantt chart in project management.
- It allows connecting tasks
You hardly find a project where tasks exist separately from each other. Usually, they are presented in certain orders. For example, a finish date of one task gives a start to the other.
In a Gantt chart tool, you can easily connect tasks with dependencies to show the relationship between them.
Let’s take an example.
You need to plant a tree. With the help of the diagram, you will be able to connect interdependent phases.
Dig a hole → place a tree → straighten it if needed→ fill the hole → carefully handle it if needed.
This consequence of events shows that you can’t start with the last action as it is dependent on the previous ones.
Here’s the feedback from Anika Albrecht, a project manager and consultant at design for human nature GmbH:


It’s definitely very helpful because I manage three projects and clients at the same time. Very overwhelming, a lot of stuff going on, but using Gantt charts, I can always be updated and see where we’re at for every project.
- It can be shared for presentation
Robust Gantt chart solutions provide with the Sharing and Export features as one of the benefits. They allow showcasing plans, current or any other states of a project to anyone outside your team: stakeholders, clients, customers, etc.
- It keeps motivation and focus
Once a project plan is ready, this becomes a point of reference for you and your team in case you manage a team project. This is like the single source of truth that helps to avoid a project scope creep.
Also, some people work more efficiently when they have everything structured in one place and where the progress, goals, and results are shown with a clear focus and no ambiguity. And remember about resource allocation: it will keep project participants motivated as the tasks assigned to them are clearly defined.
- It is good for collaboration
Team projects can’t exist without collaboration. Forget about success if there is no collaboration in your schedule.
A cutting-edge Gantt chart generator is no longer a place for tasks and dates. It is far more than that. Tasks always need to be commented and attached with necessary documents as well as project participants need to be constantly notified about assignments, deadlines, and other updates.
A Gantt diagram can become a hub for all project-related information and communication.
- It allows allocating resources properly
Without resources, one can hardly imagine a project. Those resources can be real or virtual and they need to be properly managed.
The resource workload feature helps managers avoid situations when some resources are overloaded and some are free for performing tasks.
Proper allocation leads to proper budget management.
- It shows a critical path
A critical path is a feature that shows the connection of the most important tasks needed for a project to be timely completed. If one task from the critical path on a Gantt chart is delayed, the whole project will be delayed too.
Disadvantages of using Gantt charts
- No place for uncertainty
One of the core limitations of a Gantt chart is that it perfectly serves for projects where all the tasks, milestones, deliverables, and dates are known from the start – all in all, this is how the Work Breakdown structure works.
However, this is not the dead end. Efficient Gantt chart creators allow making adjustments at any moment of project development. The Auto scheduling function will change the dates of interdependent tasks automatically.
- May not be suitable for too large projects
This is an arguable point. However, some managers find it challenging to work on long-term projects of two and more years with the help of a Gantt chart. They say that adding new tasks and resources to a plan will force you to constantly scroll up and down your chart to find the item you are looking for.
However, breaking down a large project into smaller ones can turn this disadvantage into a benefit. Also, search options are at your service.
- It needs to be constantly updated (doubtful)
Yes, projects will require time on management and updates. But what does not require it to do work?
All the work you do will take your time. However, you can make these processes shorter turning yourself into a rockstar of a certain application where you are like a duck to water.
Where to use a Gantt chart?
Thanks to timeline and tasks oriented nature, Gantt charts find their application in dozens of spheres with few limitations.
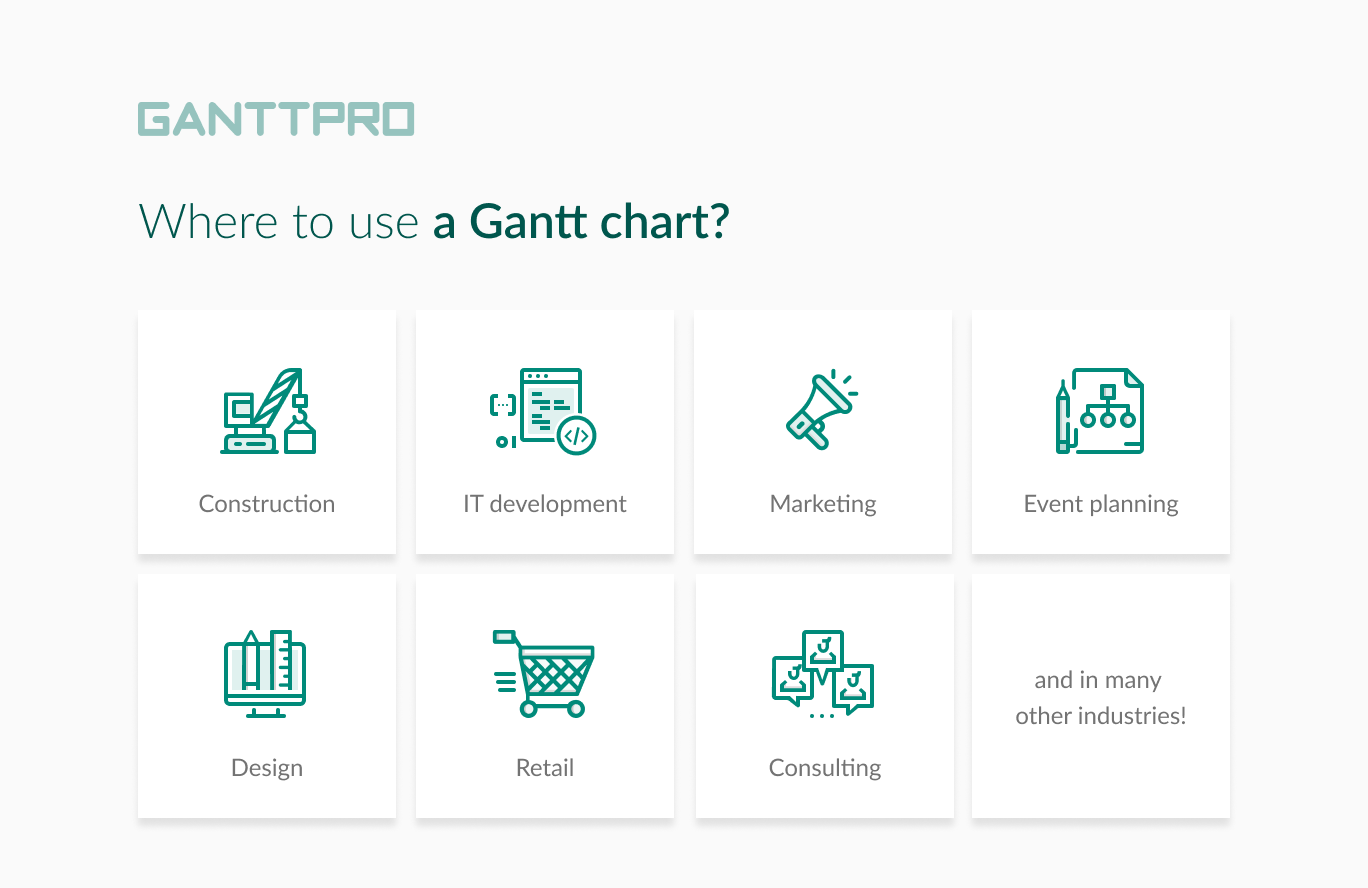
Gantt chart for IT development:
- Website development.
- Software development.
- Game development.
- Program development.
- Agile software development.
- App development.
- Android application development.
- Mobile app development, etc.
- Construction project schedule.
- House construction, renovation, remodeling, etc.
- New home construction.
- Construction management, etc.
Gantt chart for event planning:
- Performance planning.
- Conference planning.
- Fundraising event planning.
- Exhibition planning.
- Workshop planning, etc.
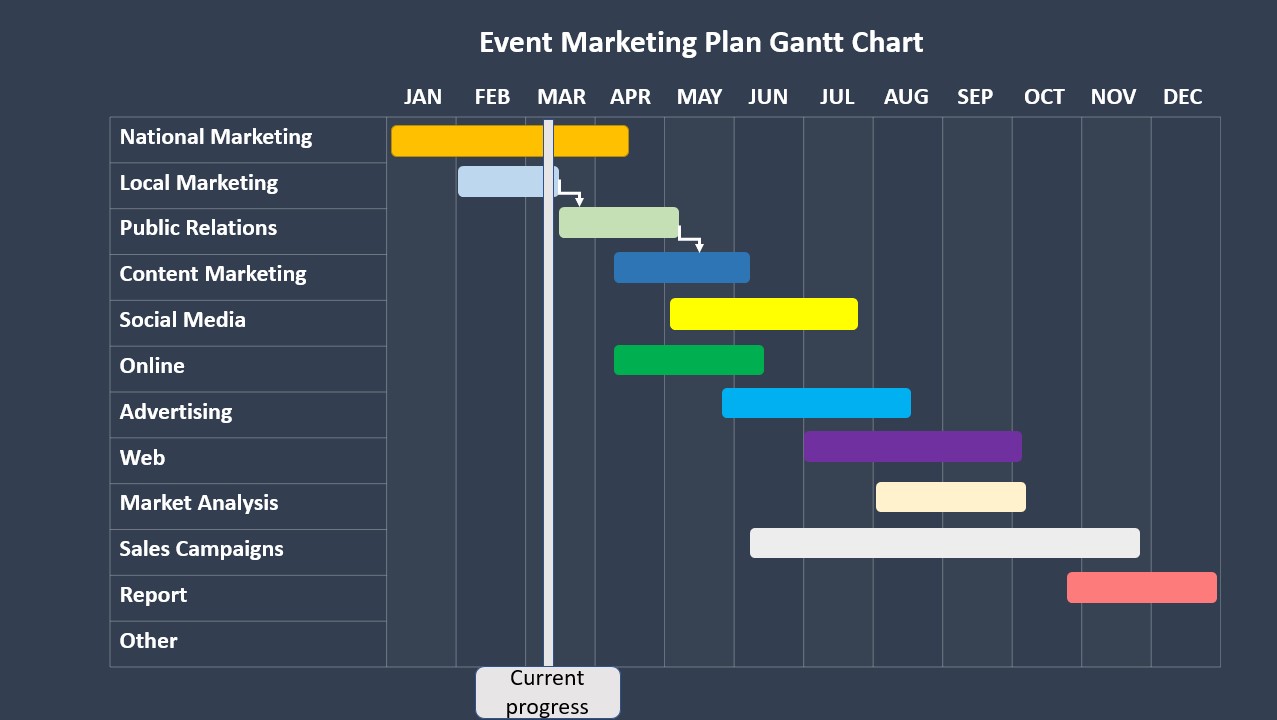
Gantt chart for marketing campaigns:
- Product marketing.
- Content marketing.
- Digital or online marketing.
- Offline marketing, etc.
- Architectural design.
- Web design, etc.
And many more!
To conclude this thought, let’s see what Elizabeth Harrin, a project manager and mentor, admits:
If you manage projects, you will have come across a Gantt chart. Even if you don’t manage projects but are involved in project teams – Gantt charts are everywhere. I’ve spent many hours working with project managers and helping them build better Gantt charts. This is the document you will use most of all. Poor planning really can kill your project.
What is a Gantt chart template?
A Gantt chart template is the ready-made chart with typical tasks and dates that you can use in a certain industry.
Powerful solutions offer Gantt chart templates for a variety of industries:
- Software development.
- Construction.
- Marketing and marketing project management.
- Professional services or maintenance.
- Manufacturing.
- Retail.
- Education.
- Event planning.
- Design.
- Consulting, etc.

Advanced project management with a Gantt chart
Plan and manage projects effectively. All in one place.
Sign up for freeUse a Gantt chart for effective project planning
Gantt diagrams are tools for robust task management, project planning and scheduling, resource and cost management as well as for communication and collaboration on a project.
What’s your attitude to Gantt charts? Do you use any software? Please share your experience with us in the comments below.
Frequently asked questions about Gantt charts
-
The term “Gantt” in a Gantt chart refers to Henry Gantt who designed this type of diagram around 1910-1915. A Gantt chart is a popular project management tool used to illustrate project timelines and demonstrate start and finish dates of project activities. It also helps in scheduling and monitoring tasks against time constraints.
-
A Gantt chart is named after Henry Gantt, an American mechanical engineer and management consultant. He designed this tool to visualize scheduled and completed work as well as track all planned tasks and their progress.
-
A Gantt chart is a horizontal bar chart used in project management to visually represent a project schedule. It includes a timeline and tasks displayed as bars that show the duration of each activity. Dependencies between tasks, progress completion, and key milestones are also typically indicated on this chart.
-
A Gantt chart demonstrates a project schedule, representing start and finish dates of project tasks. It helps project managers and teams understand and visualize task durations, dependencies, and progress for effective planning and time management.
-
A Gantt chart typically shows tasks, timeframes, dependencies, and progress. These elements help track all schedules and control project advancement.
-
A Gantt chart visually represents the timeline and duration of project tasks on a horizontal time axis. Each task is listed vertically with a corresponding horizontal bar that indicates the start and end dates. This setup allows project managers to see overlaps, dependencies between tasks, and the overall progress of their project at a glance.
-
A Gantt chart benefits project managers in the following ways: provides a clear visualization of all projects, tasks, and resources, facilitates team collaboration, and ensures smart progress tracking.
-
A Gantt chart is a great option. This type of online diagram communicates a project schedule to your team, as it visually outlines tasks, timelines, and dependencies, allowing for clear understanding and efficient project management.
-
A Gantt chart helps in tracking a project by providing a visual timeline of tasks, showing dependencies between activities, highlighting resource allocation, and enabling easy tracking of progress. This visual tool enhances communication among stakeholders and helps identify critical paths to prioritize resources and efforts effectively.
-
Yes, Microsoft Office allows for creating a Gantt chart, which can be particularly useful for project management and tracking tasks over time. You can make such a diagram in Microsoft Excel using the built-in bar chart feature. Excel doesn’t have a predefined Gantt chart type, but you can simulate one by customizing the stacked bar chart to show the start dates, durations, and completion status of various tasks.