


Project management is a versatile sphere with different methodologies and tools.
Managers all over the world try to use innovative techniques and new trends to improve their business results. But there is at least one component that appears in every project. In this article, we’d like to share some basic and interesting facts about project timelines and Gantt diagrams.
Should we have special skills to create a simple timeline? Probably, not. Everyone can build at least a plain Bible timeline chart, but we are not going to describe them here.
But if your goal is to properly arrange the events on the timeline and manage specific tasks with its help, you need to be prepared and to explore related issues, such as Gantt diagrams and PERT Charts for project management, Work Breakdown Structure, prioritization techniques, etc.
A timeline is the required basement of every project. It is difficult to imagine a management task, which would not be connected with time.
Who uses timelines?
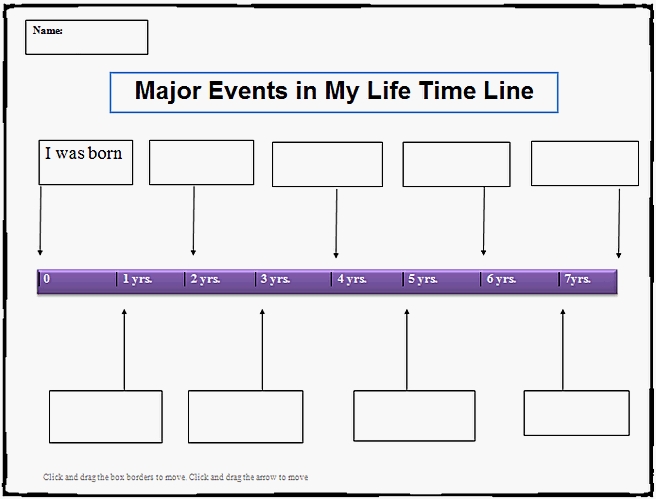
Students and kids use visual project timelines and charts for their simplest tasks.
Do you remember how you were trying to find the necessary tools and templates to build a timetable during the study? It could be any historical or social science project.


What is a timeline chart in project management?
Timelines are extremely important in project management because they help to visualize time-related metrics, synchronize tasks, set deadlines and define potential delays. The diagrams are useful for managers who want to get a high-level look at their tasks or view any time-related metrics.
Timelines will help you to visualize three main timeframes: planned time, actual time in-progress that shows how long tasks have been in progress and forecasted time.

Why managers need timeline diagrams?
Project managers know that setting expectations for delivery time is an important and challenging aspect of management. Using timelines and charts, they avoid low-quality releases and deadlines.
The diagrams add transparency and give you a chance to analyze what happened in the past and plan the future.
Usually, managers use timeline charts for:
- Projects and tasks planning.
- Road mapping.
- Portfolio management.
With the help of timeline charts, users can highlight dozens of objectives on one screen and show how they can be connected with each other. It’s possible to compare planned and actual end dates and get forecasts.
Timeline diagram components
The diagram structure depends on the tasks description. Timelines may be highly detailed or simple. They can contain hundreds of tasks and subtasks or have only a few deliverables.
If you need to build a timeline for your goals, you should pay attention to:
- The set of tasks and objectives to be completed.
- All dates and deadlines.
- Dependencies between objectives.
- Expected duration of tasks.
Actually, timelines can take many forms, but the most popular and powerful option is Gantt Chart.
Gantt Chart includes horizontal bars which represent the duration of tasks. It really provides an easy visual depiction of the project.
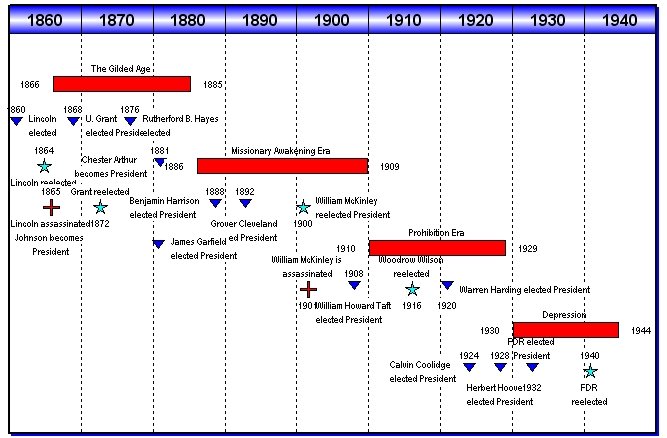
Here’s the timeline of American presidents from 1860 to 1940:

This chart that was developed by an engineer Henry Laurence Gantt (1861-1919) more than 100 years ago is a powerful management tool nowadays.
What are the purposes of timeline charts?
If you work with complex or simple objectives, you know that they may have many moving parts. Sometimes these parts can be time-sensitive, so make sure everything is planned properly and runs according to your schedule.
Timeline charts are good for projects involving many people. It doesn’t demand a lot of time or efforts to make a chart and keep it.
Online project timelines are similar to Gantt charts as these both diagram types deal with time and events.
5 Gantt Charts benefits
Companies apply these charts to become more productive, increase communication, forecast and track their results.
You can define and list many advantages of Gantt charts, but we are going to highlight the 5 key benefits:
- As Gantt charts keep users on track and provide a visual timeline for starting and finishing tasks, they really help to avoid project’s completion confusion. The charts propose an understandable method of maintaining timescale-based tasks and deliverables.
- If you manage a complex task, Gantt project plan diagrams eliminate misunderstandings and keep everyone on the page. It’s quite important if there is a visual framework for the objectives to be done. The charts allow everyone in a team to have the same information and set mutually understood expectations.
- The diagrams help to clarify task relationships and get the best workflow and overall success.
- Users can clearly understand where resources need to be allocated or shared. That’s why we can confidently say that the charts effectively divide resources.
- The charts help decision makers to look ahead to ensure each given project is working toward the achievement of the company’s strategic goals.
How to make a project timeline?
Today managers have possibilities to use any specialized project management software to create and manage their tasks with the help of charts and diagrams.
This software includes templates and tools that can reduce the efforts needed to create and maintain project schedules.
The majority of the charts are based on WBS (Work Breakdown Structure) that clearly defines all task requirements.
Want to find a useful tool to create your charts?
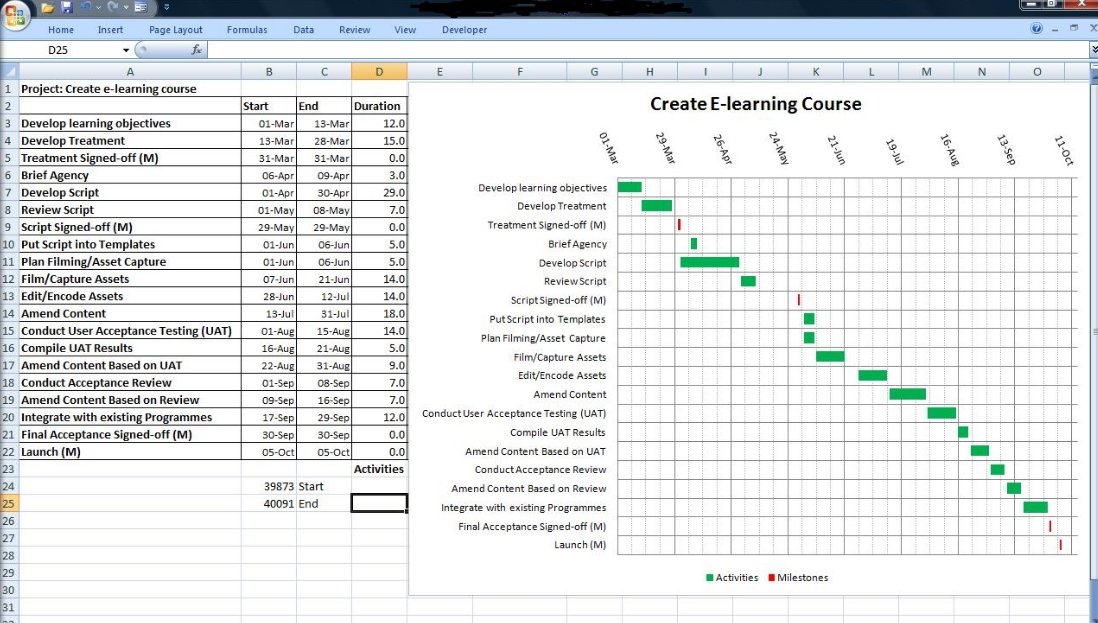
Excel options for making a timeline chart
Microsoft Excel proposes a scatter chart. You can format it and create a timeline diagram.
Gather the key events and critical deliverables of your project. These milestones will be used for a timeline. Then you will need to add the column with some plotting numbers.

If your aim is to build a diagram for recurring communications to customers and executives, it will be better to use PowerPoint options.
Gantt Chart view with PowerPoint
Microsoft PowerPoint produces simple charts and timelines. The program proposes an intuitive interface and tools for creating great looking Gantt diagrams in minutes.
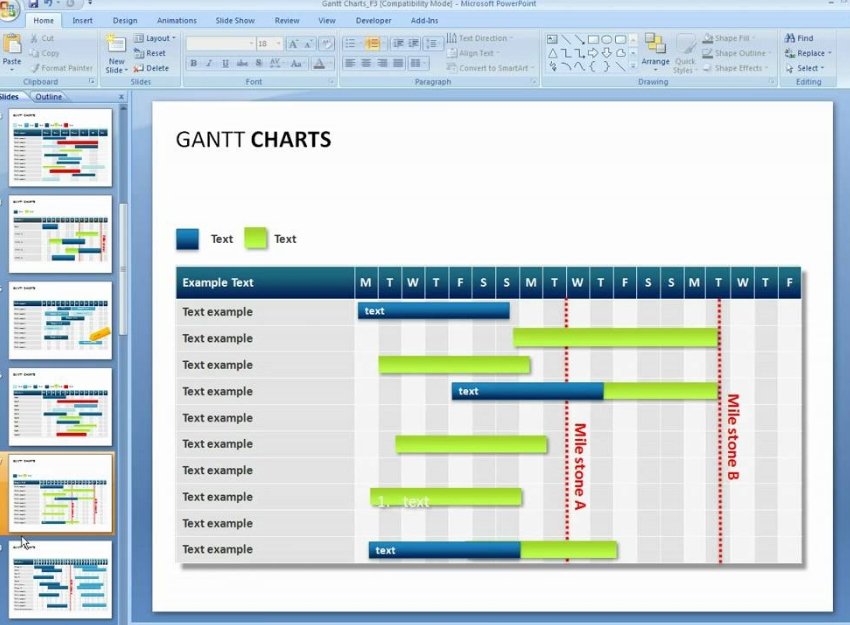

But it requires some efforts and patience to make a timeline chart from scratch. However, users prefer this easy and impressive visual way.
Project managers also use it but it’s difficult to present such timeline to the audience who need a high-level chart that is visual and intuitive. А great solution in this case, is to take advantages of GanttPRO software for timeline creating. However, you will find some other simple and effective ways to create Gantt charts in PowerPoint. For example, you can use MLC PowerPoint Add-in.
GanttPRO options for creating project planning diagrams
Project management solutions like GanttPRO allow managers to create Gantt charts and use them to refine the schedule in real time.
GanttPRO will help you to create the plan of your objectives and manage them with timelines and Gantt project management diagrams. Using simple GanttPRO tools you can provide your customers with activity duration estimates, track progress, visualize plans, share and export Gantt Charts to XLSX, PNG, etc.
If you need to import Excel Gantt diagram in GanttPRO, you should apply the following steps: Click the plus button (+) at the top left of the dashboard and add an XLSX or CSV file.
Then click the import button and move your file.
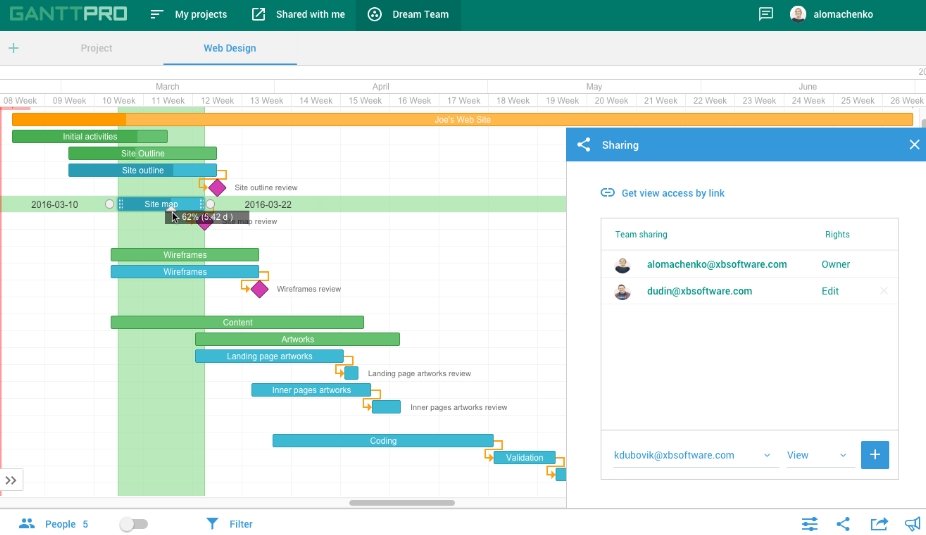

Here is a Gantt Chart view in GanttPRO.
Enjoy your timelines and GanttPRO time management diagrams!