


We’ve improved the way of working with project portfolios in GanttPRO online Gantt chart maker.
From now on, you’ll be able to see a detailed big picture of your projects in one place, getting even more insights with dashboards.
Let’s figure out what’s new in this release.
Portfolio menu
Like virtual resource conversion, the portfolio update has been one of the most requested features.
The first thing that has changed is that portfolios are now managed in a separate menu in the sidebar. From there, you can create, manage, and delete them.
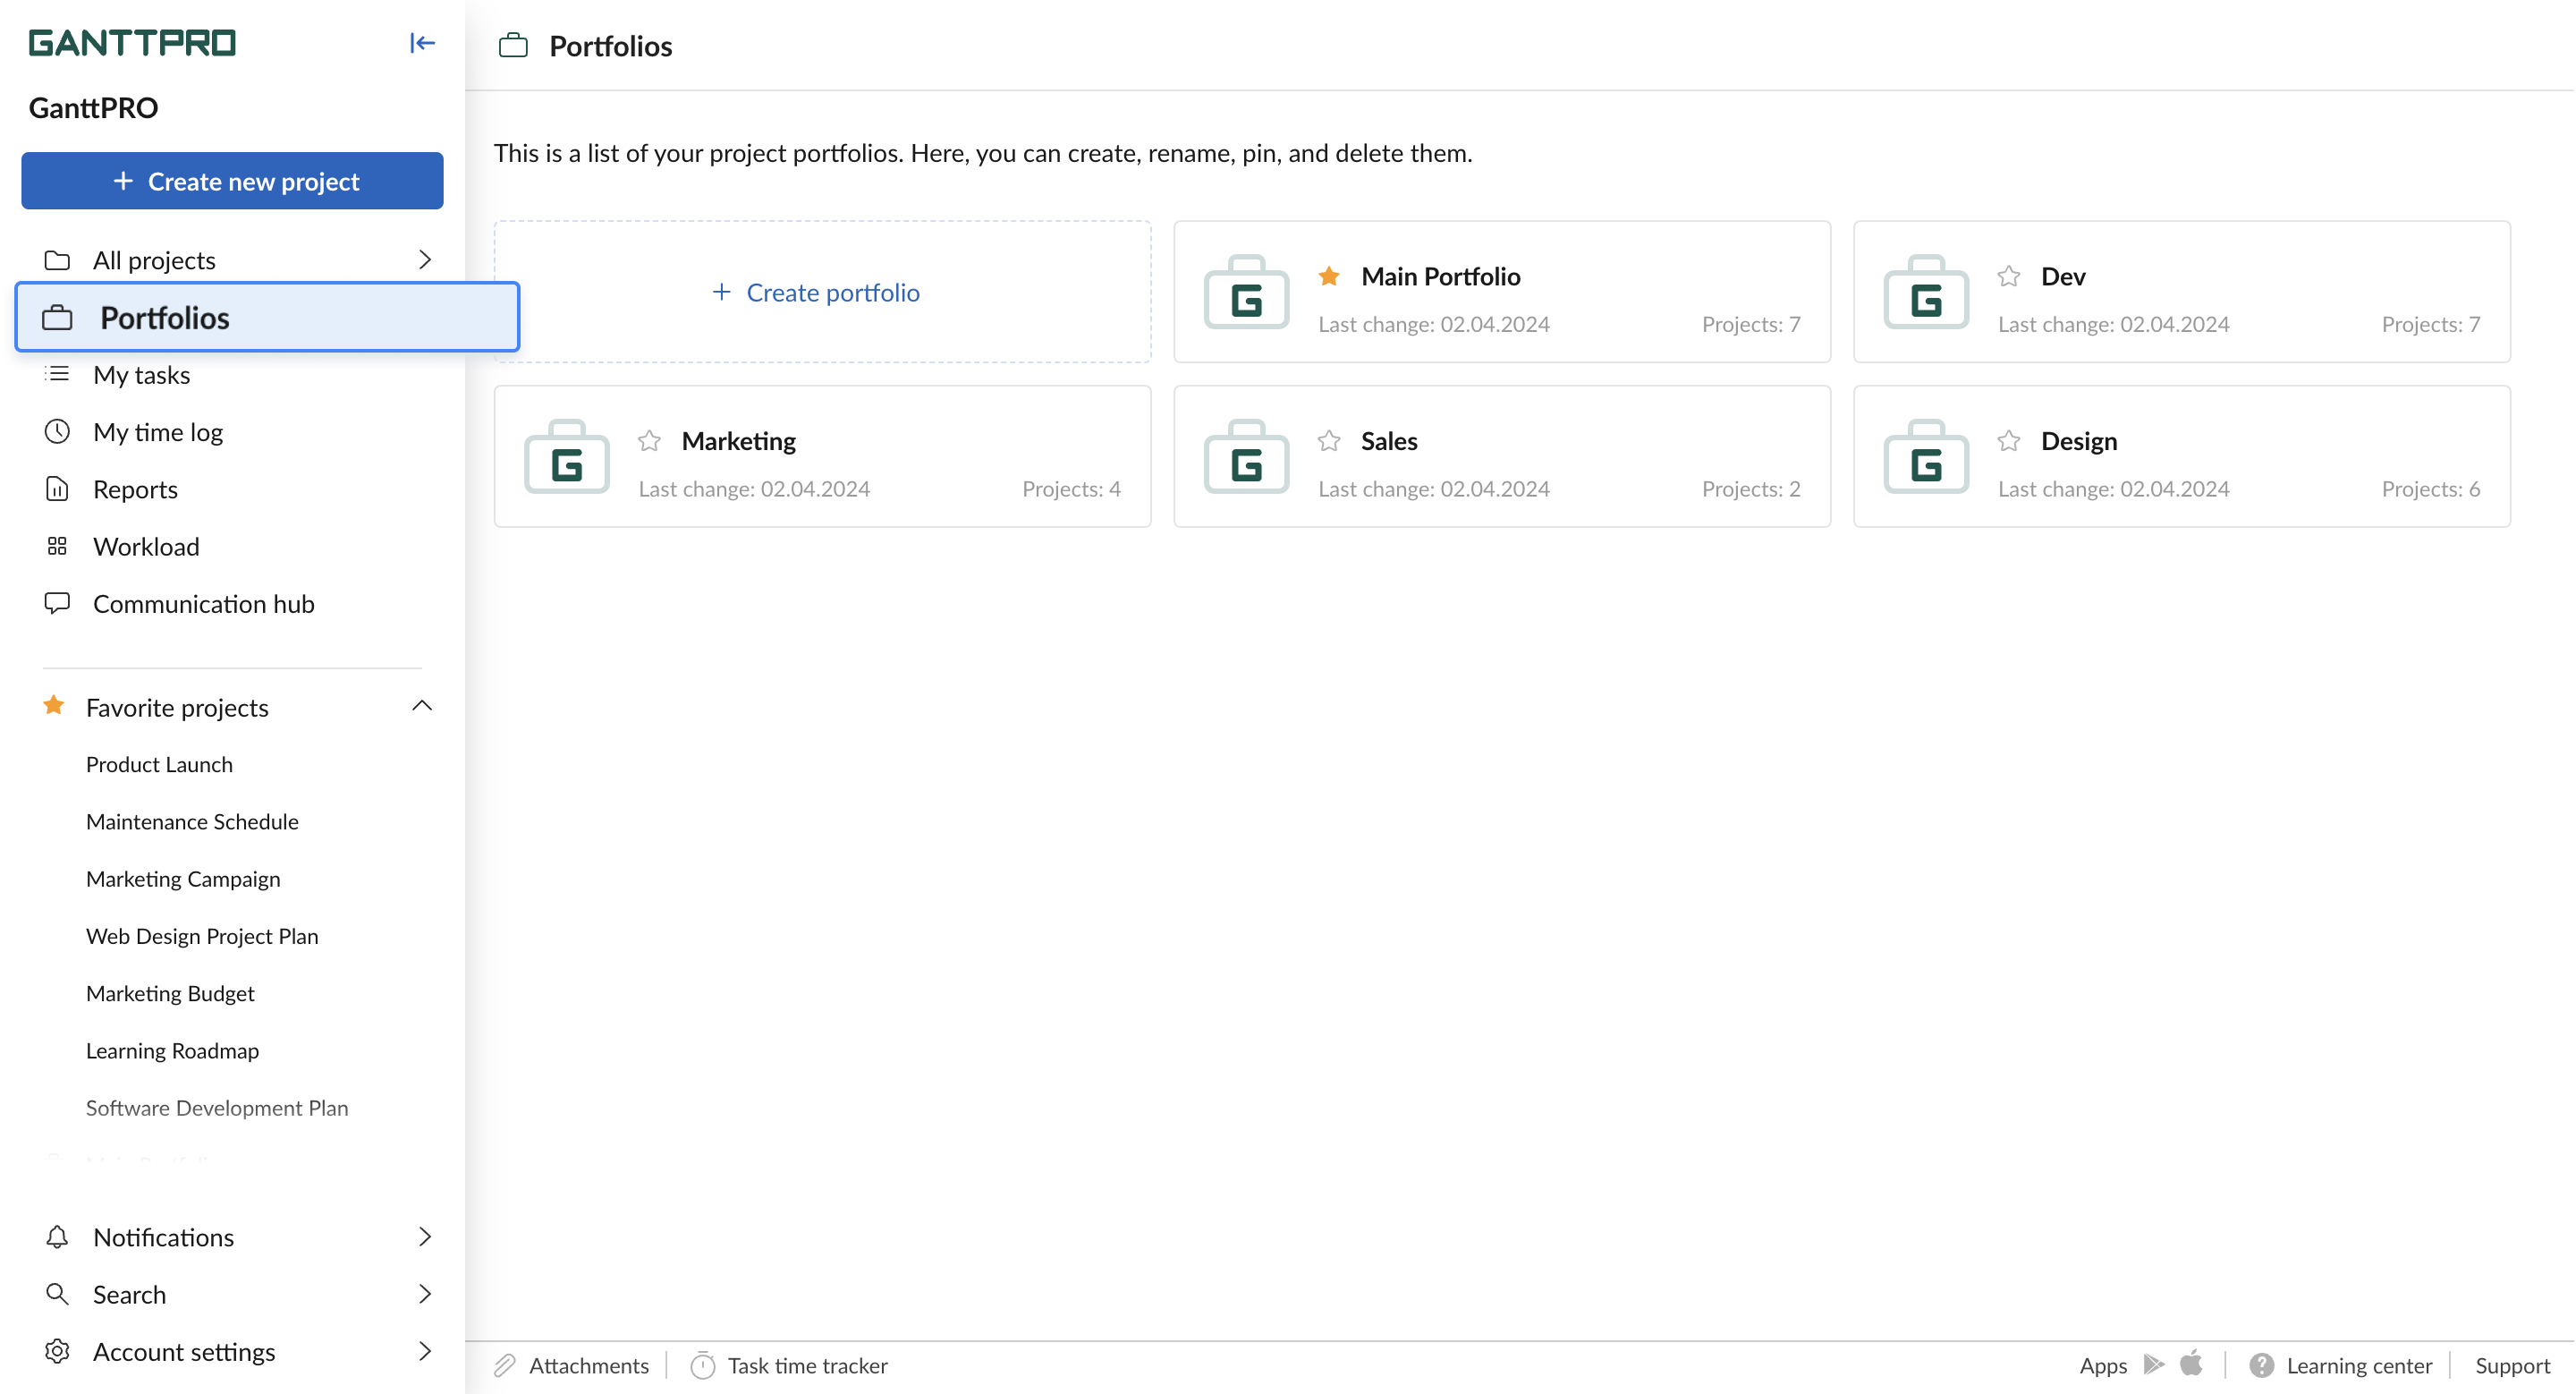
Inside any portfolio, you will find 2 new tabs. These are Projects and Dashboard.
Projects tab
Here, in real-time, you will get a detailed big picture of all the projects from the selected portfolio with the project details like:
- Name.
- Status.
- Progress.
- Start date.
- End date.
- Project owner.
By the way, you can easily sort these details in all the fields.
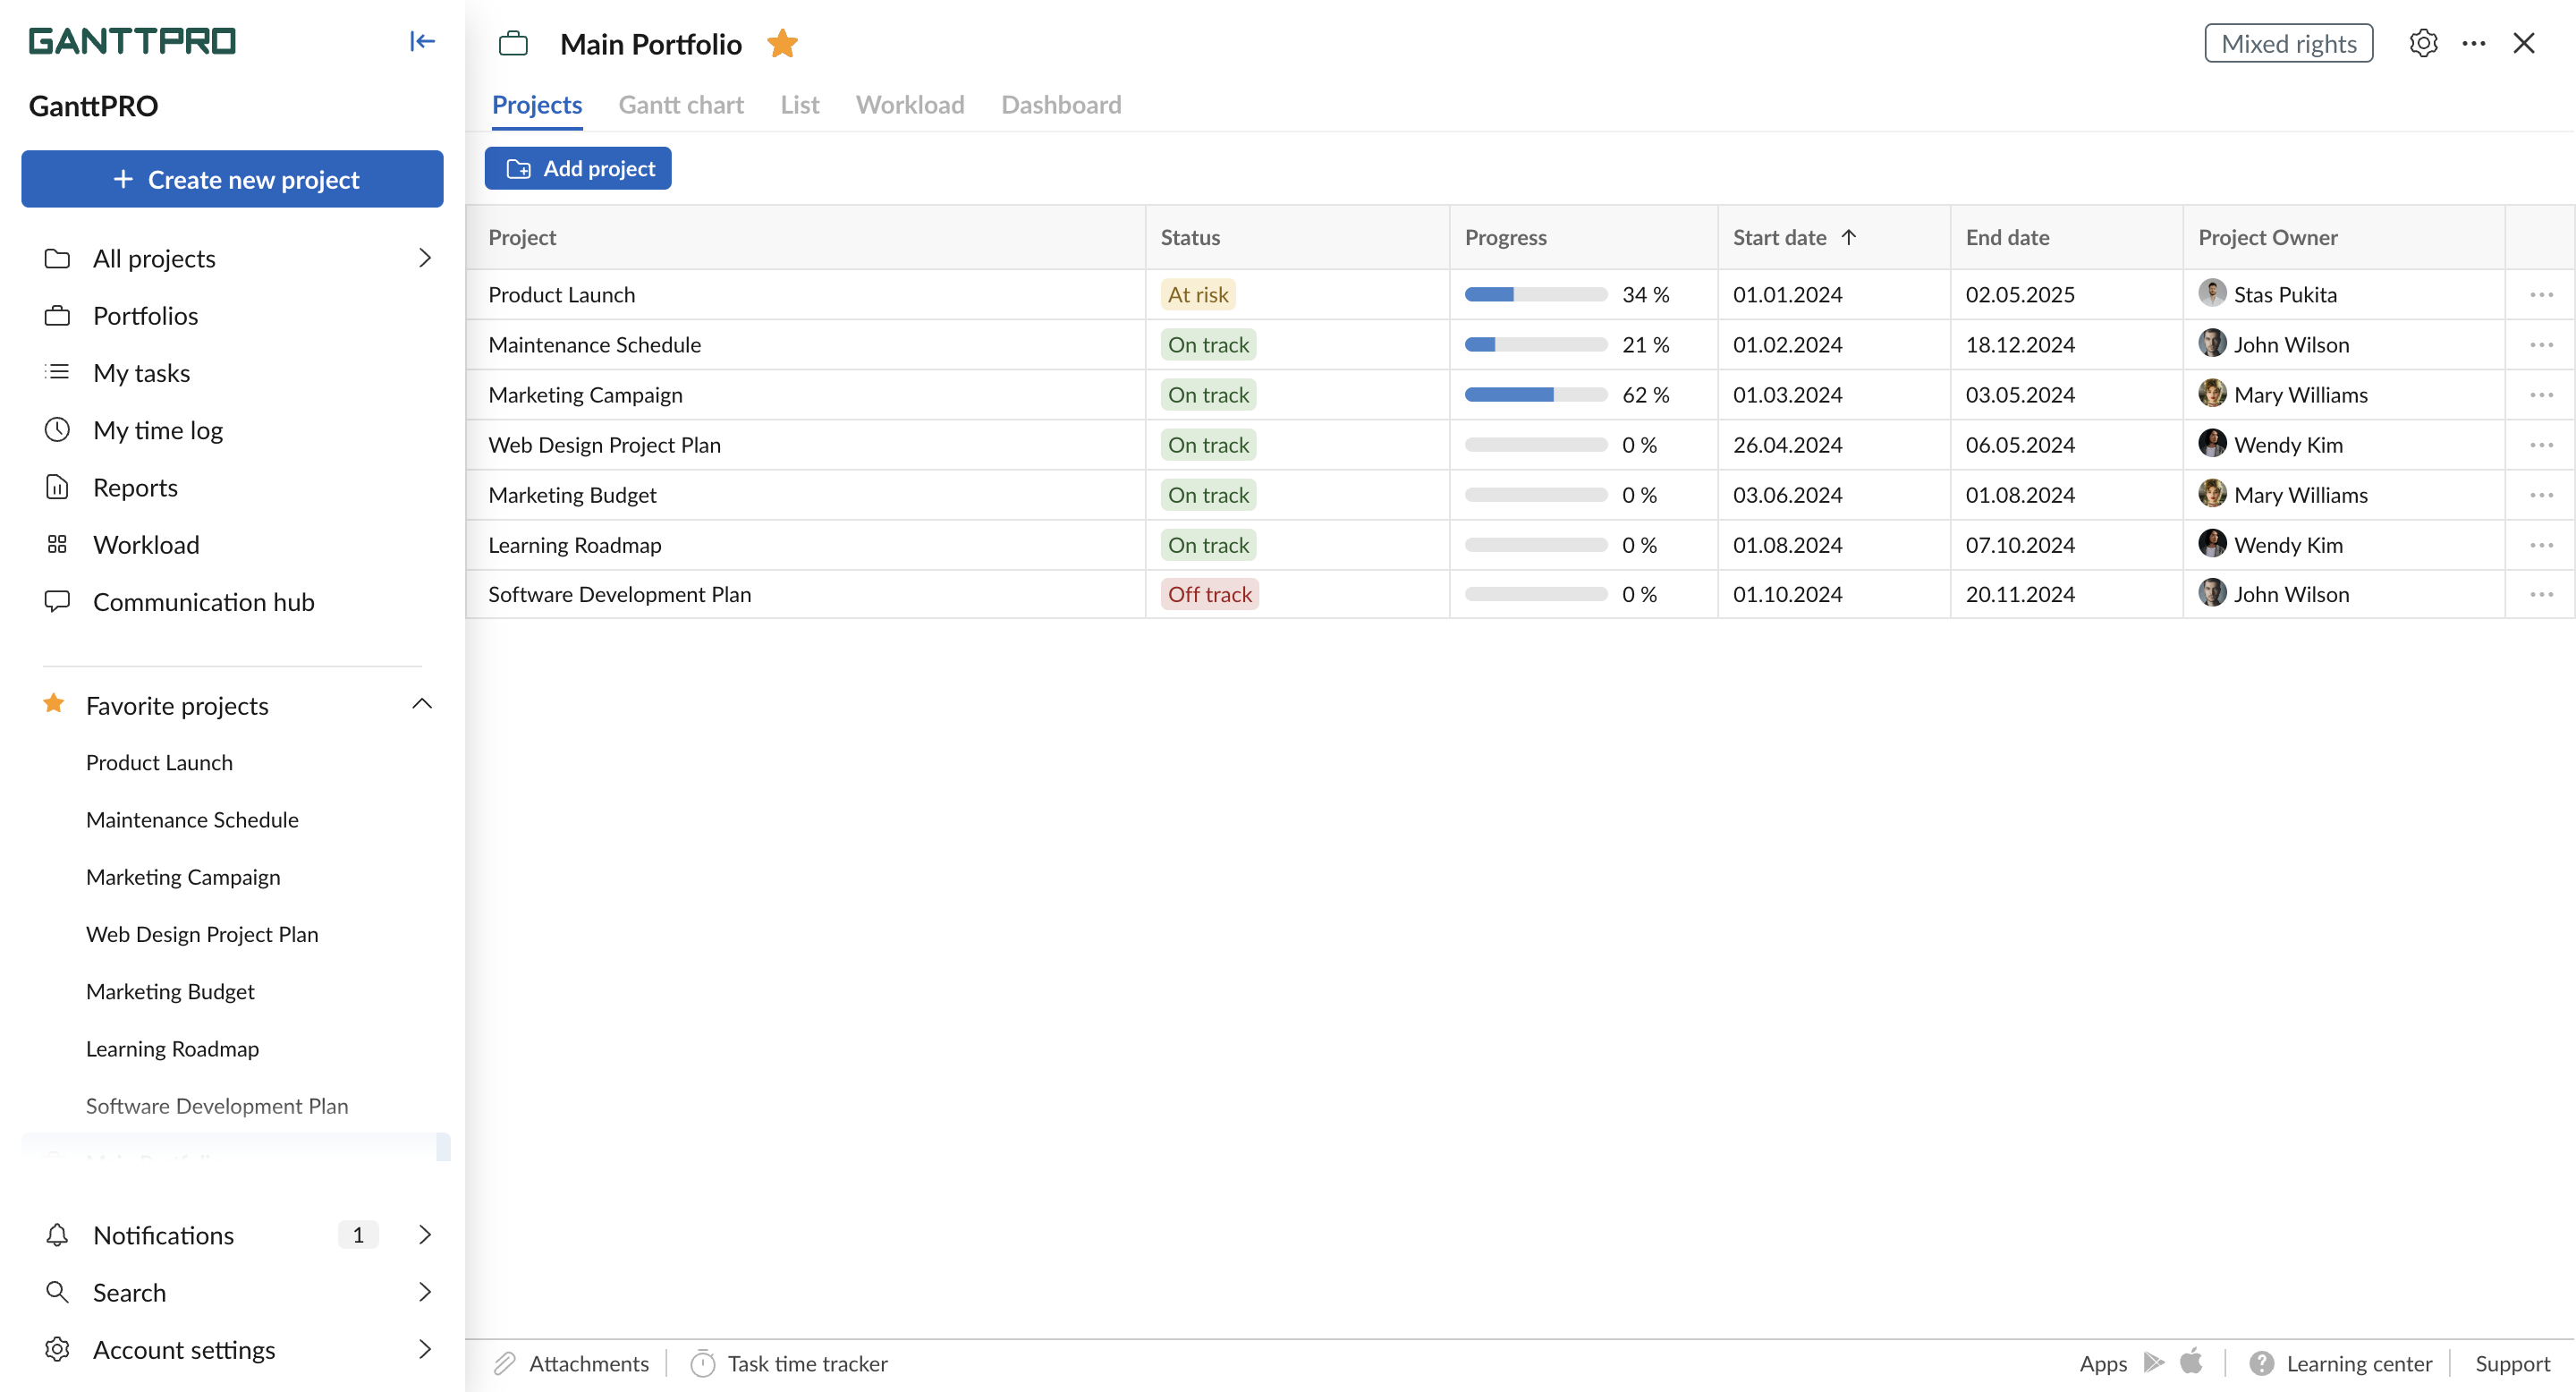
From this tab, you can go to any project you need by clicking on the button with three dots to the right of it.
There, you can also remove any project from your portfolio.
Note: removing a project from a portfolio will not affect this project as a whole. It will still be available in the “All projects” section.
In addition, in just a few clicks, you can add any other project to your portfolio.
Dashboard tab
The section looks like the Dashboard section when you work on a project level. However, their widgets differ and include:
Let’s take a closer look at each of them.
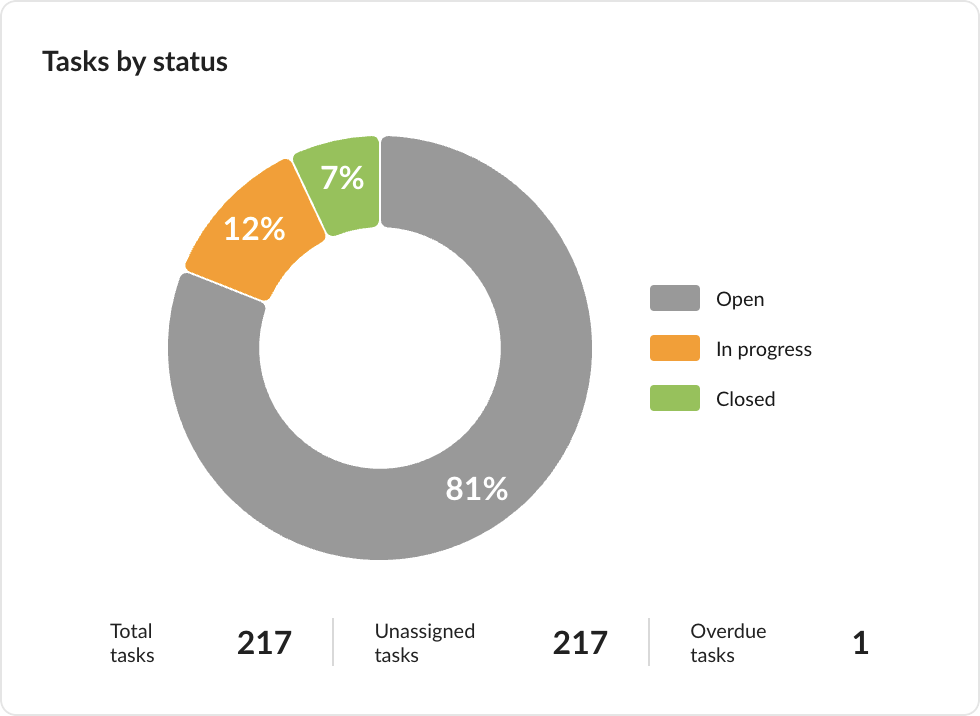
Tasks
This widget shows the same information and in the same way as the corresponding widget on a project level.
On a color-coded pie chart, you will see the statuses of your tasks as a percentage and how many of them are:
- Open.
- In progress.
- Done.
- Closed.
At a glance, you will also see the total number of tasks, how many of them are unassigned and overdue.

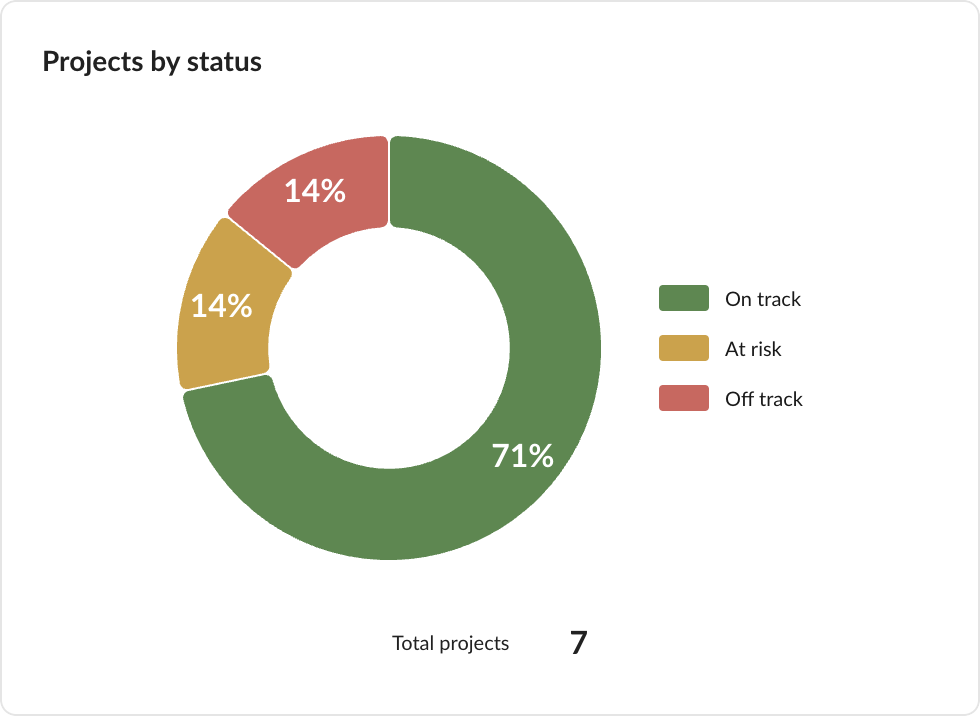
Projects by status
This widget displays information exactly in the same way as the Tasks widget.
On o color-coded pie chart, you will see the statuses of your projects as a percentage and how many of them are:
- On track.
- At risk.
- Off track.
At a glance, you will also see the total number of your projects.
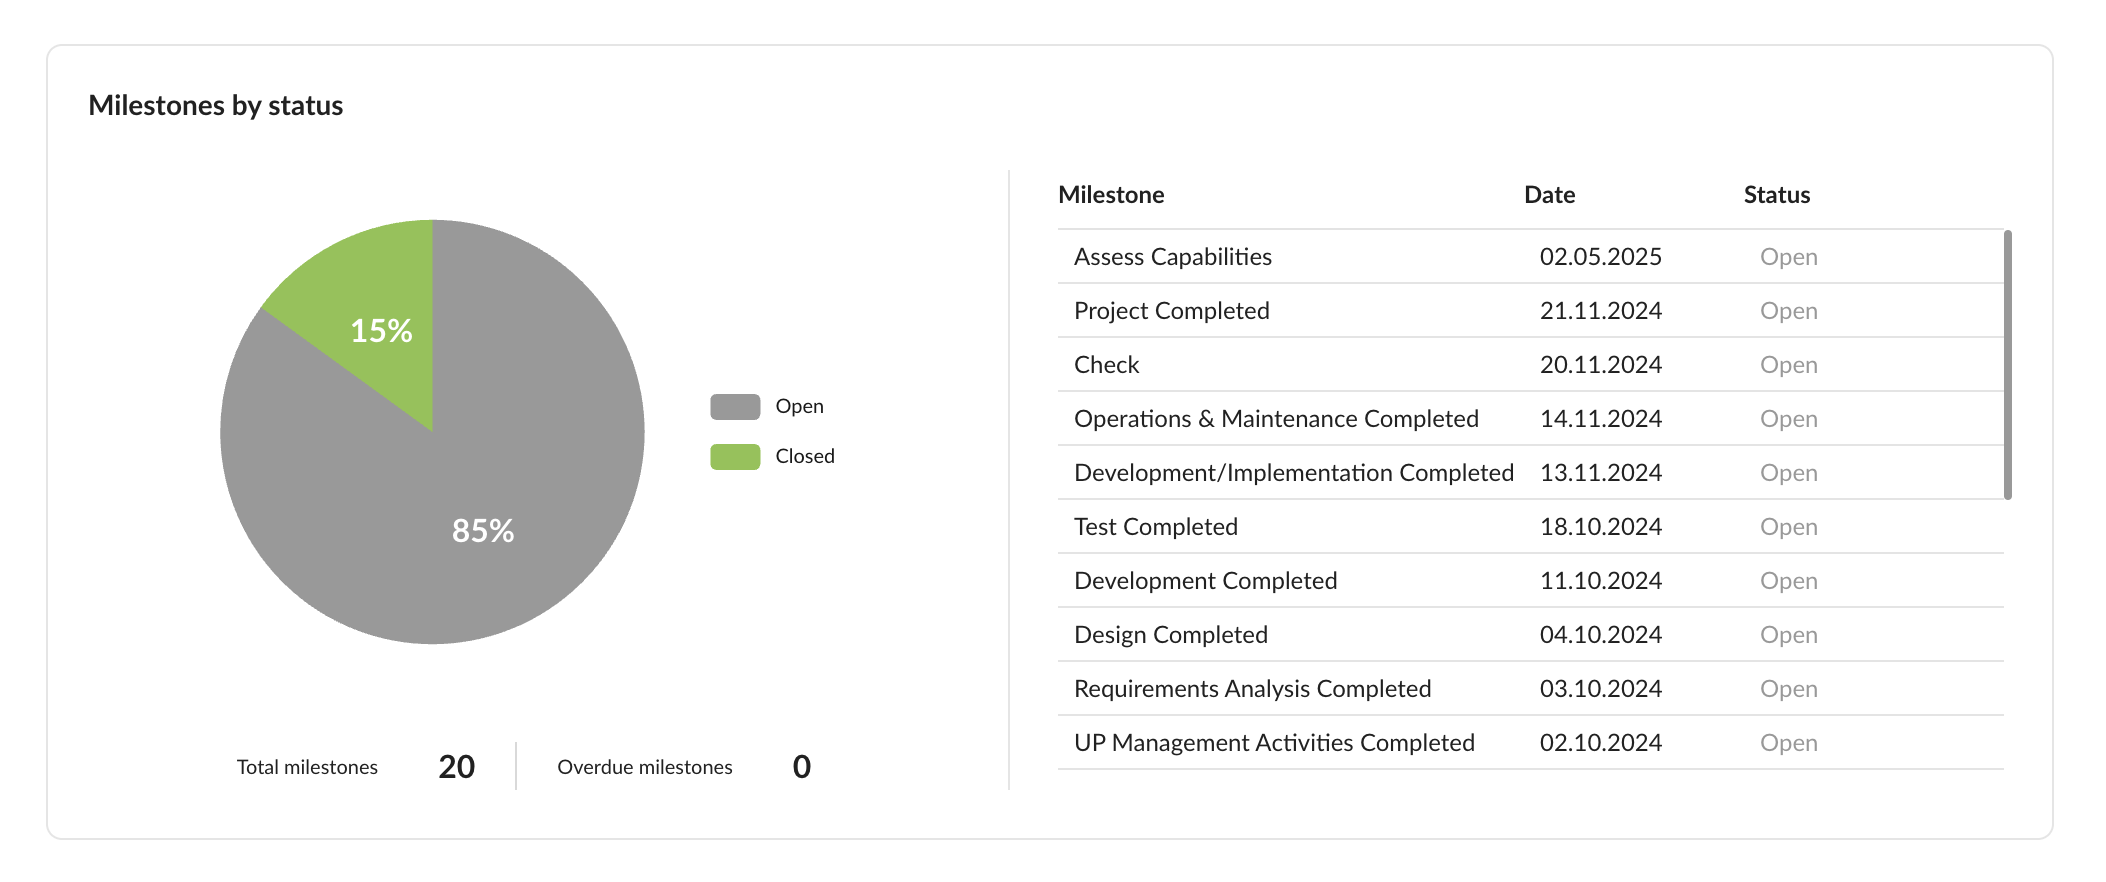
Milestones by status
This widget shows the same information and in the same way as the corresponding widget on a project level.
On a color-coded pie chart, you will see the statuses of your milestones as a percentage and how many of them are:
- Open.
- Closed.
You will also see the total number of milestones and how many of them are overdue.
Also, you will find a table here with details such as names, dates, and statuses for each milestone separately.
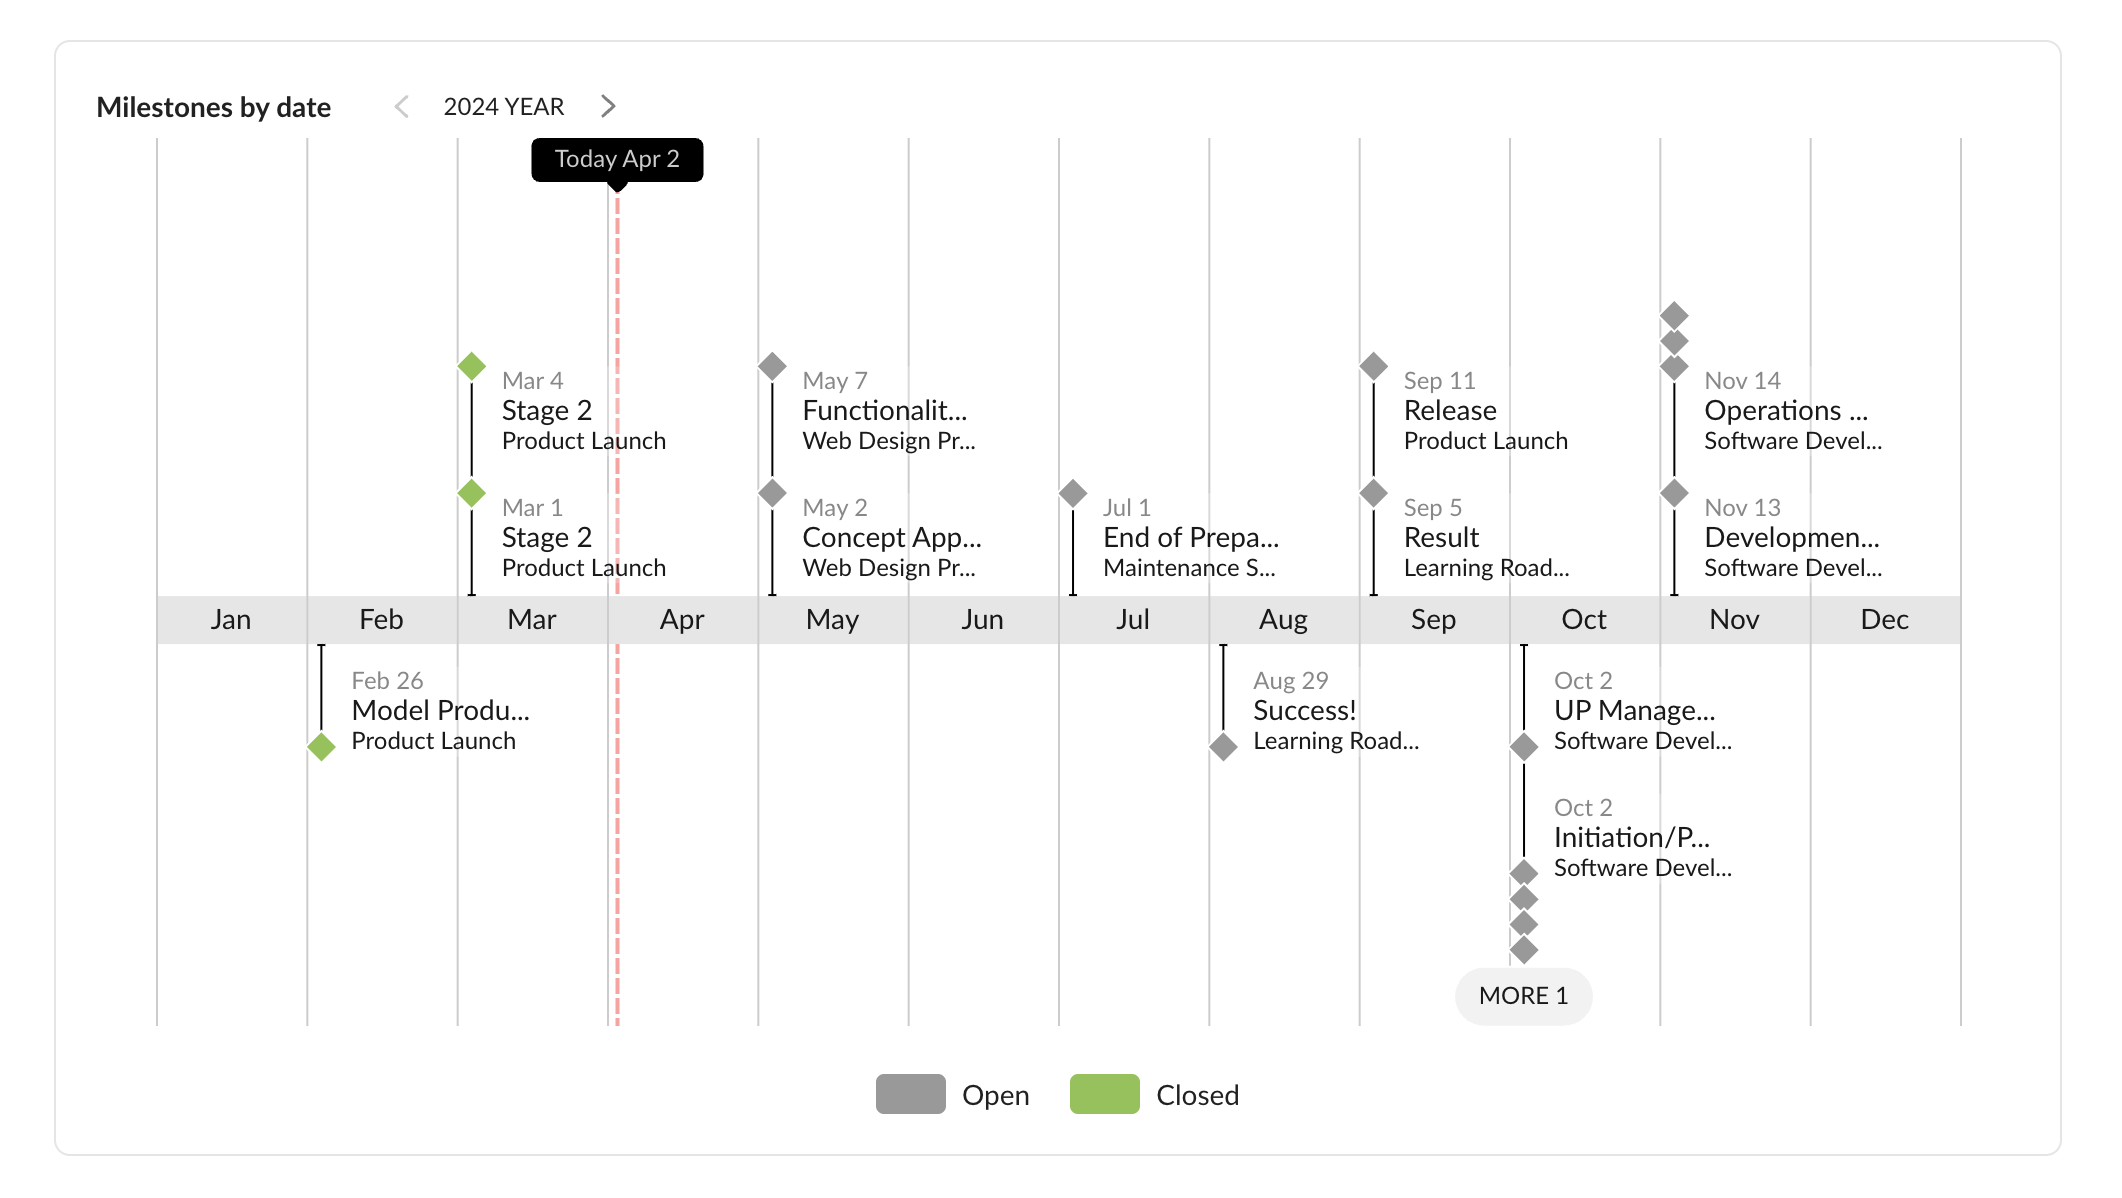
Milestones by date
This is a completely new widget with a chronological timeline that shows milestones and their statuses on a monthly basis.
Need help?
If you have questions about how to work with project portfolios, ask us in the Live chat.