


We continue to improve our Reports section.
The previous major update included graphical reports.
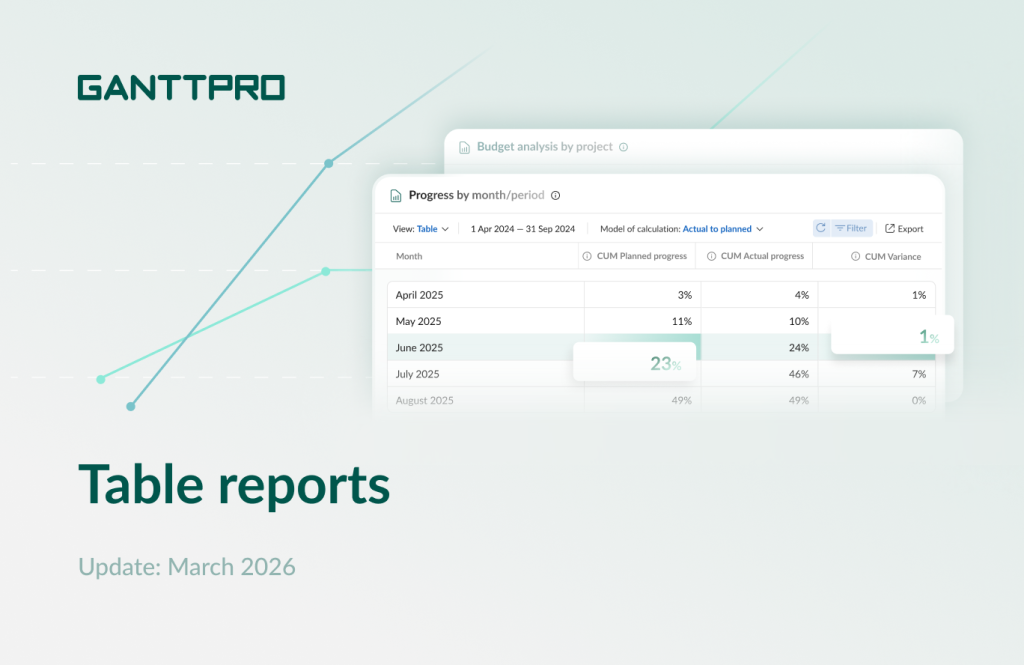
This time, we are introducing table reports.
They provide even more flexibility for tracking progress, budget, and time spent on tasks. As with graphical ones, these new reports allow you to analyze data across one or multiple projects, as well as portfolios.
What table reports are available
You can create the following table reports in GanttPRO online Gantt chart software:
- Progress S-Curve.
- Budget analysis by project.
- Budget S-Curve.
- Time on tasks analysis by project.
- Time on tasks S-Curve.
- Time on tasks analysis by resource.
These new table reports provide you an additional way to:
- Gain deeper insight into what’s happening across your projects.
- Detect deviations and potential risks more quickly.
- Foster clear communication and collaboration with stakeholders, clients, and other third parties.
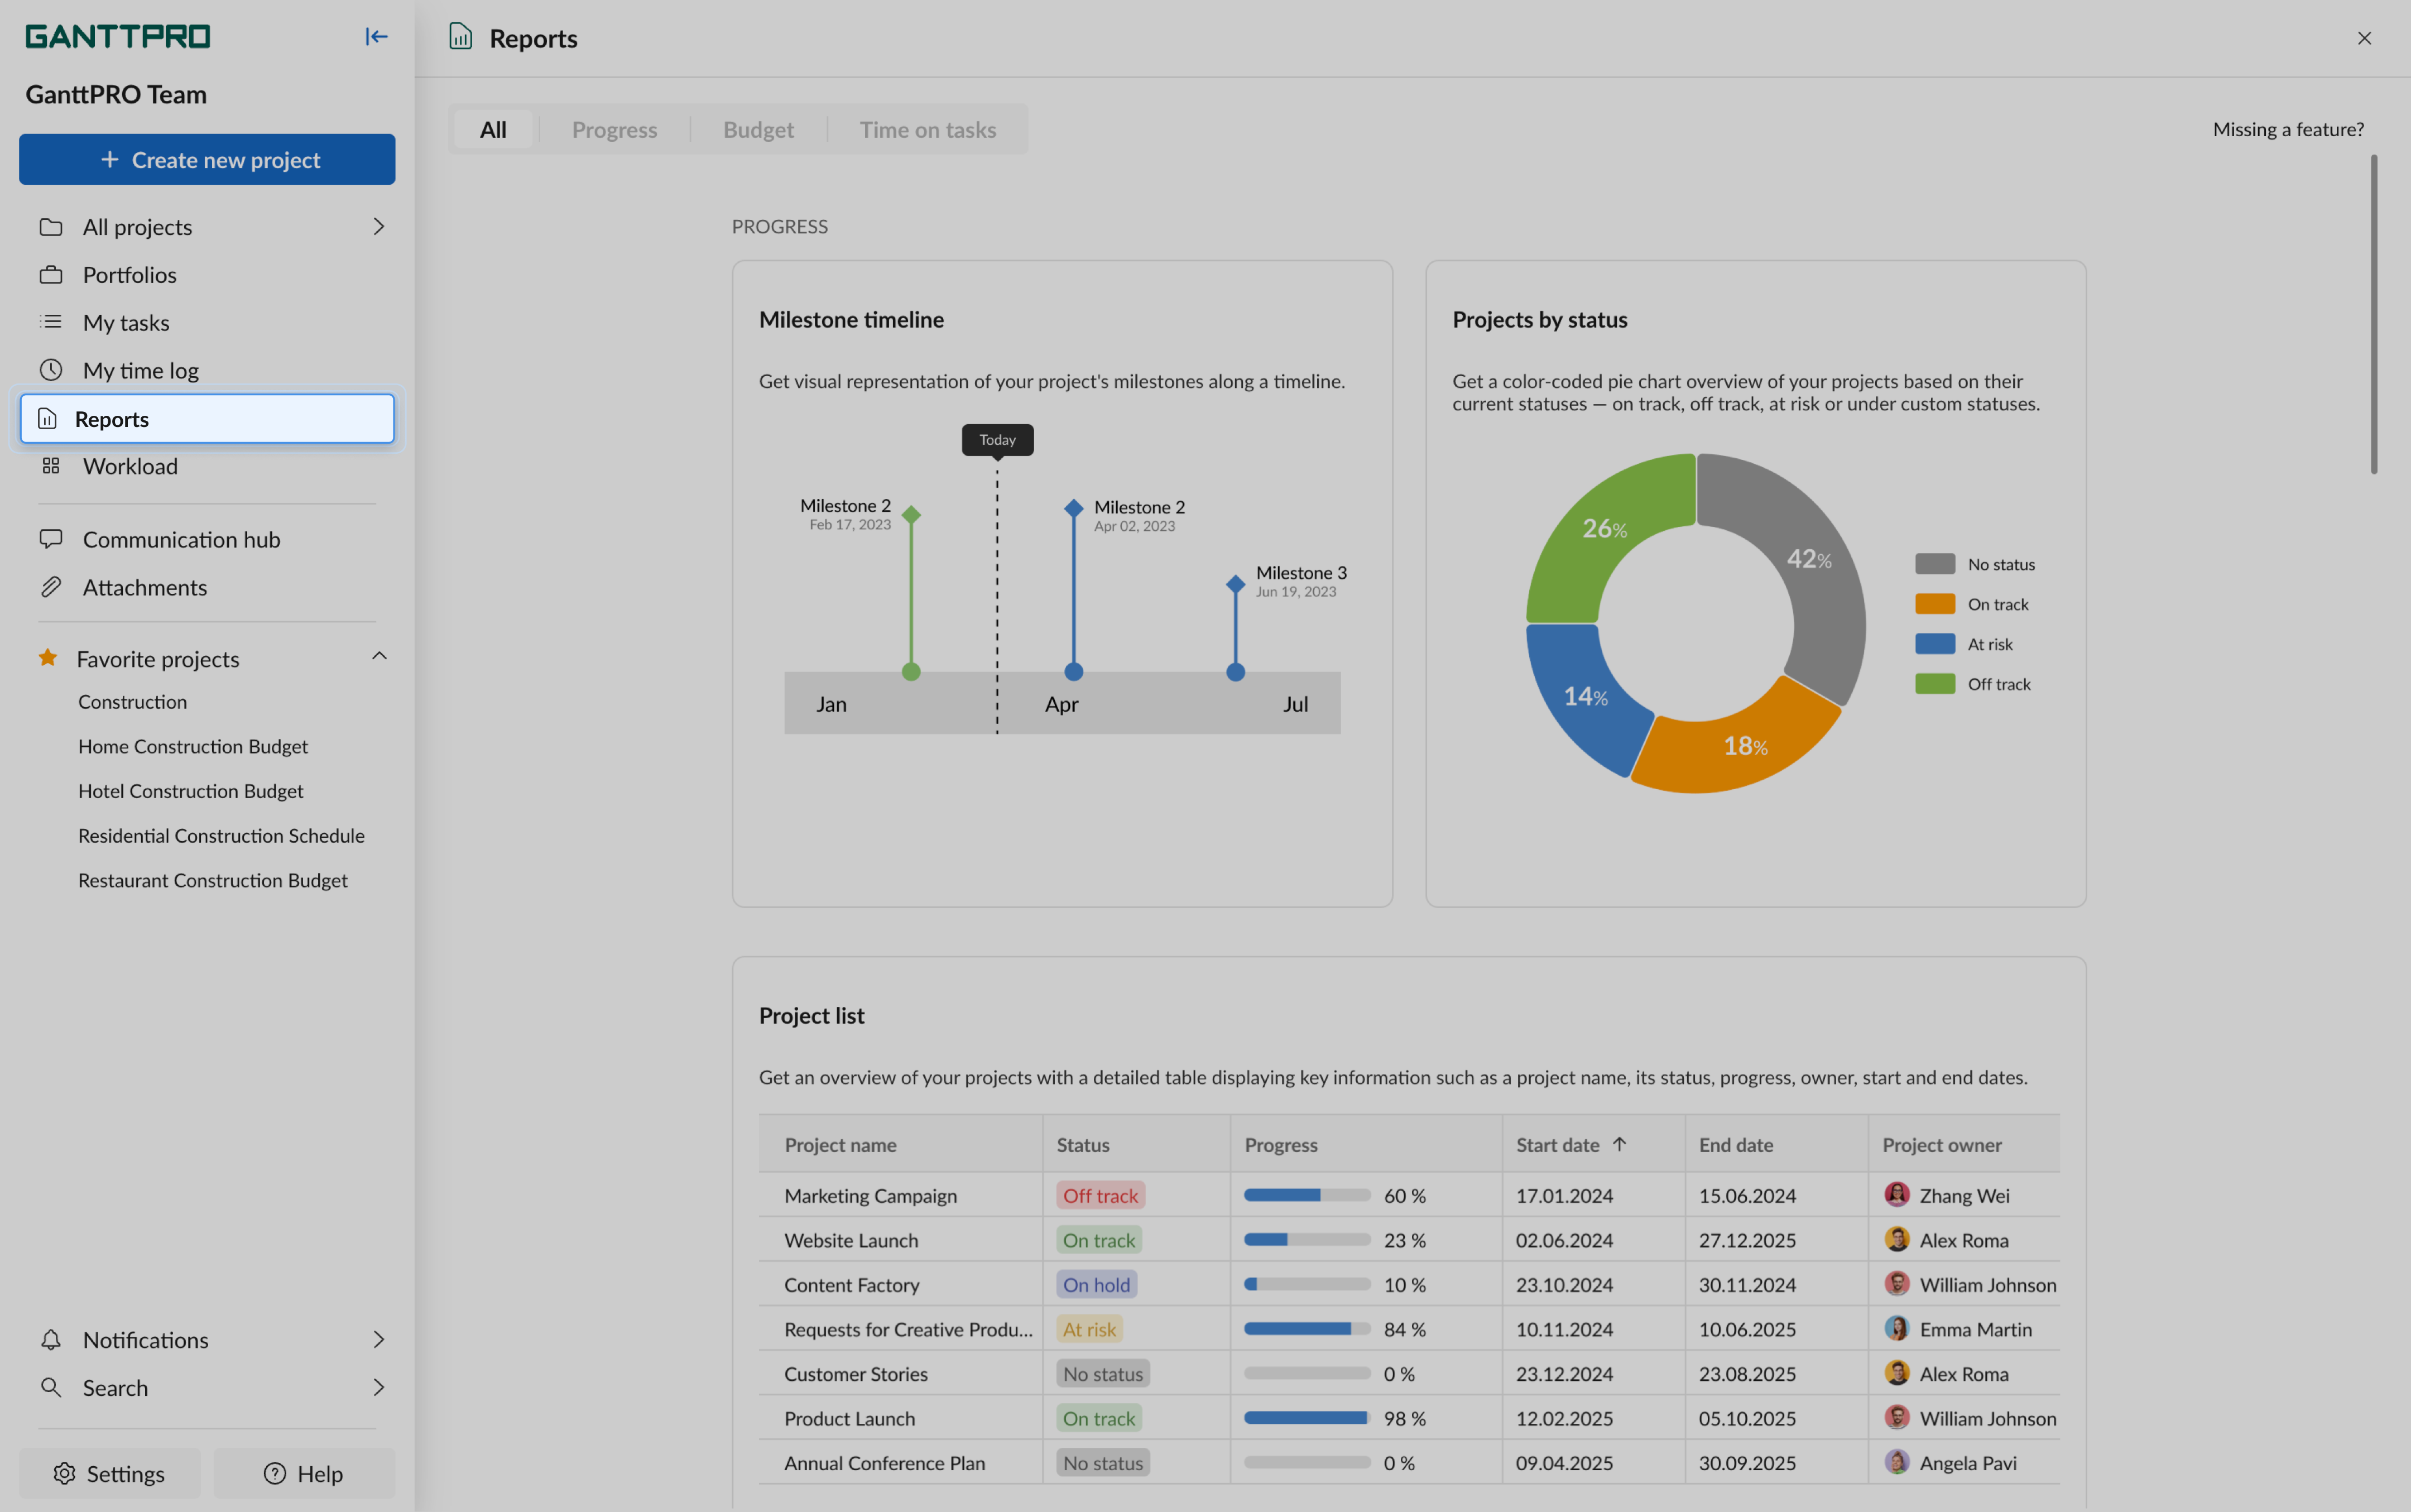
To find and use the new table reports, go to the Reports section in the left sidebar.
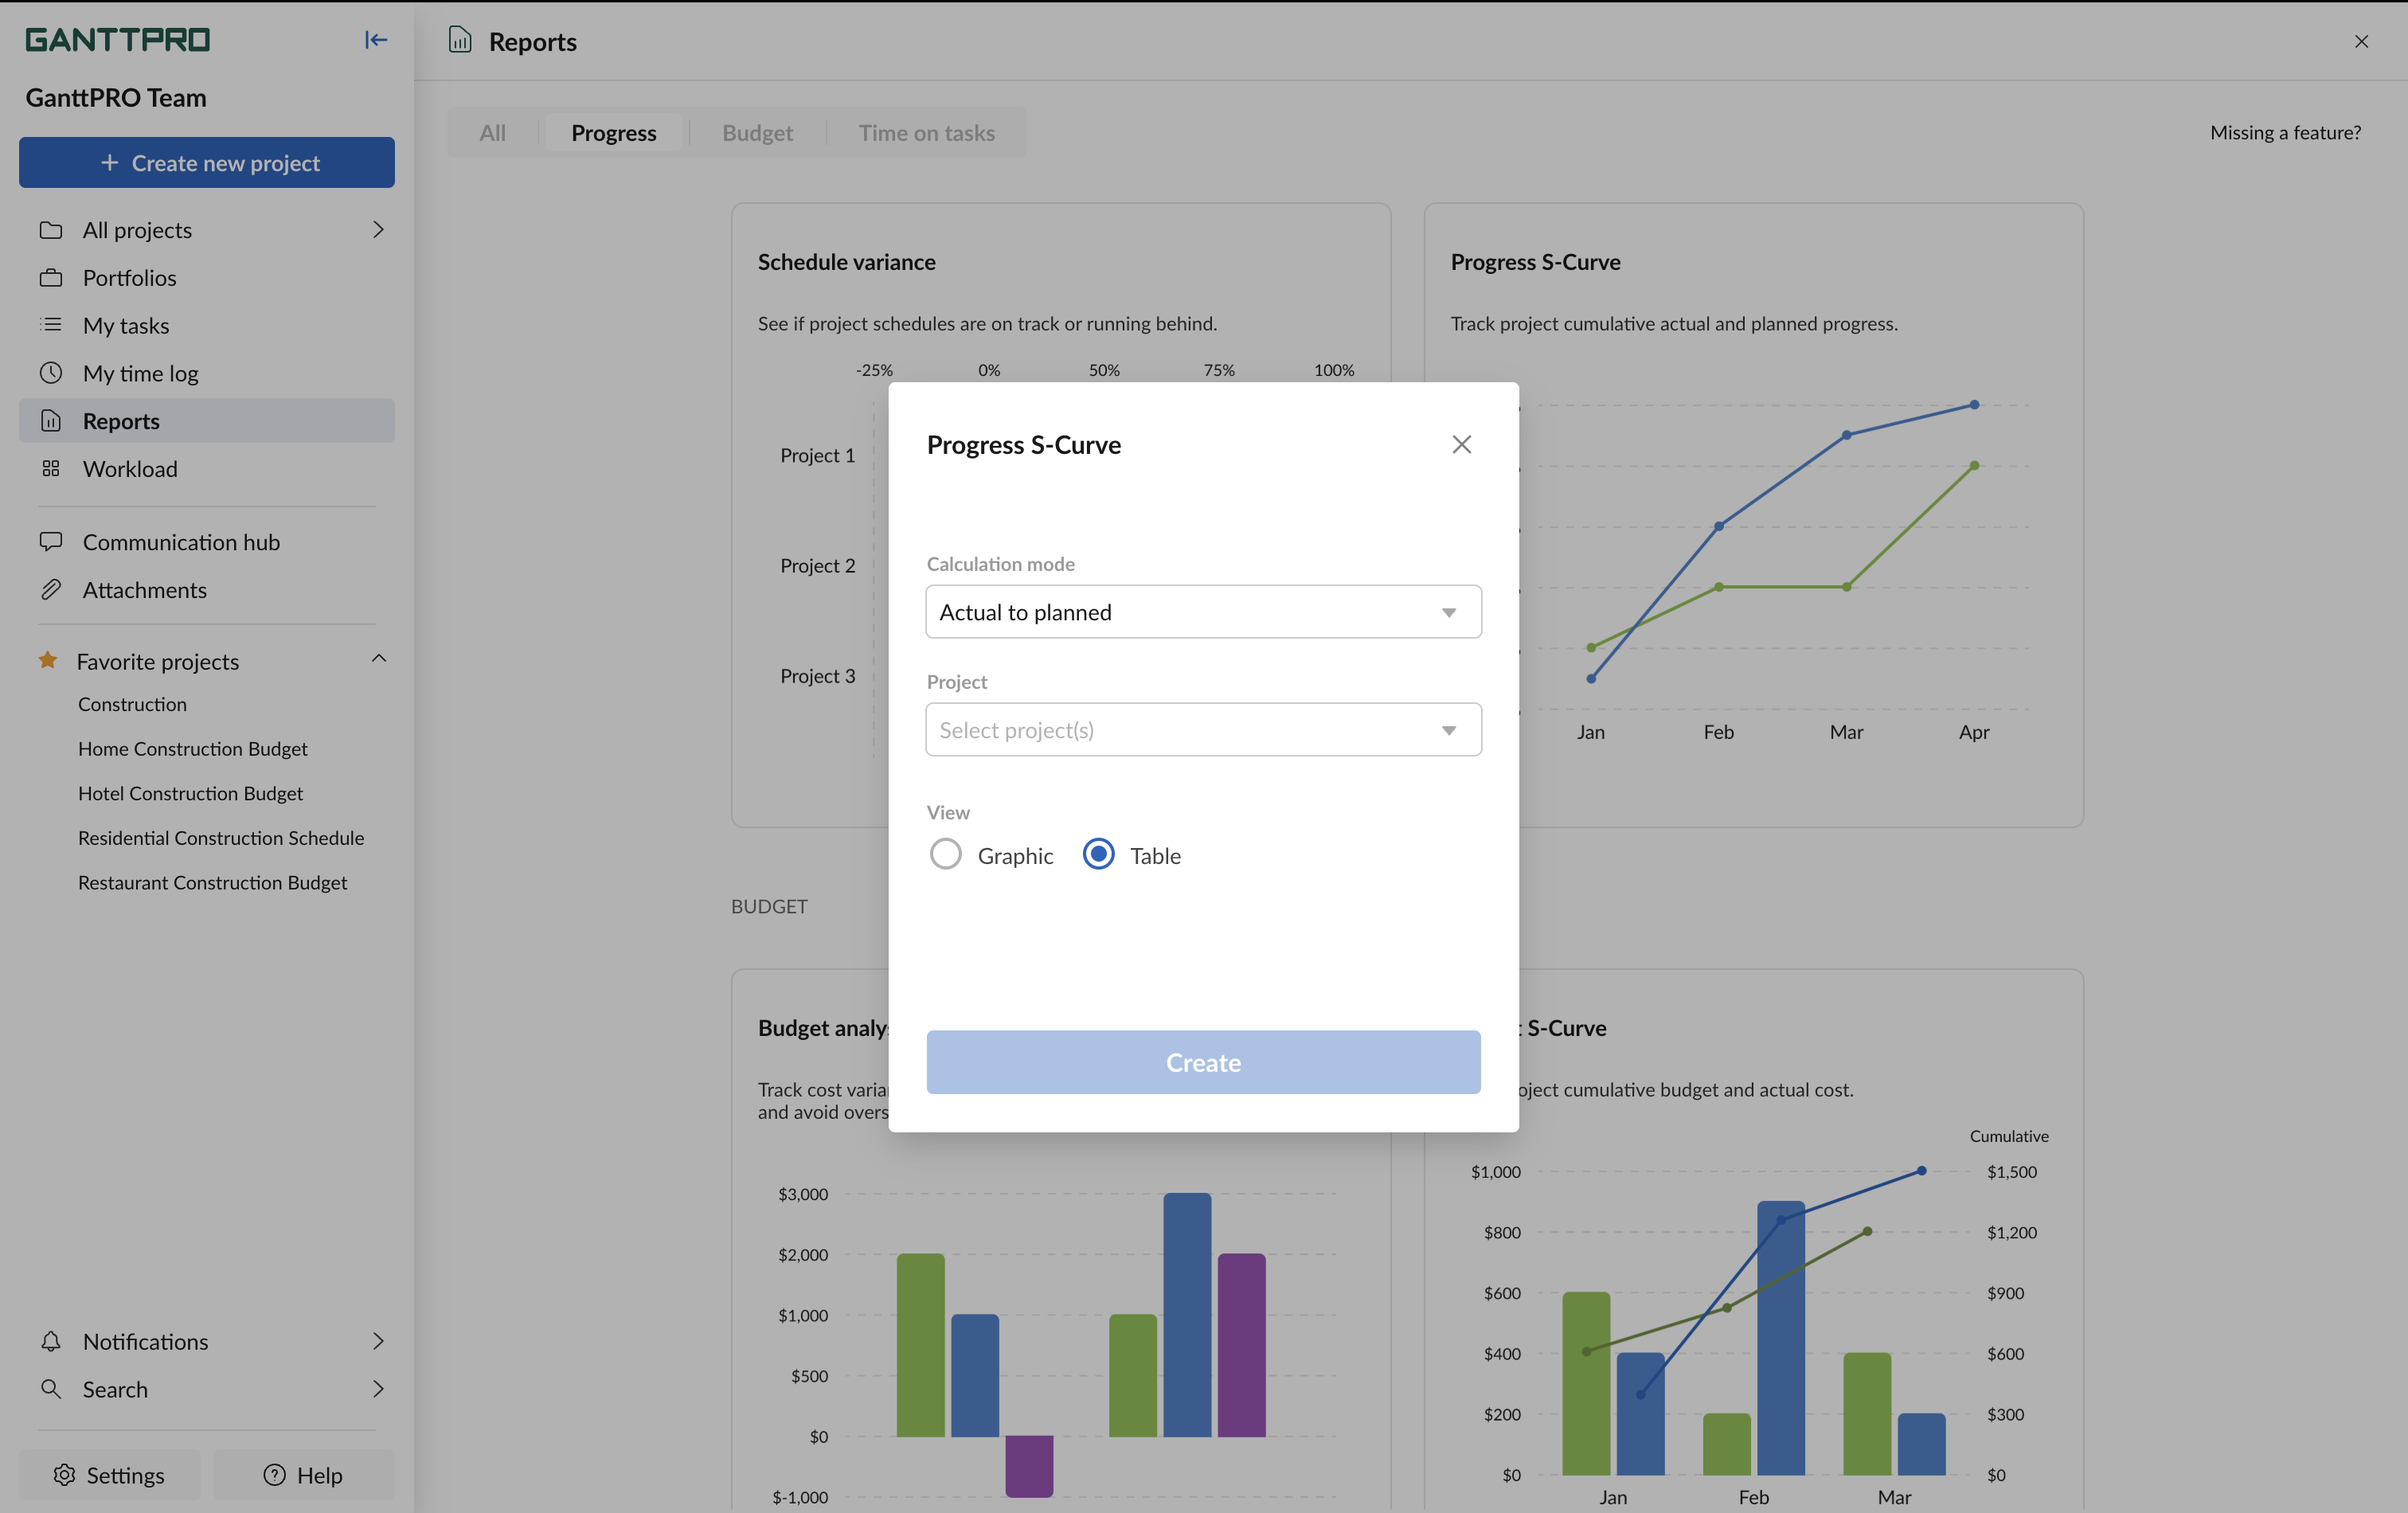
To create one, select the desired type and click Create to get started. A pop-up window will appear where you can choose between Graphic and Table options.
Note: not all reports are available in table view.
Now, let’s take a closer look at each report.
Progress S-Curve
This report will help you track project cumulative actual and planned progress. In other words, you will see whether your project is on track or not.
You can include here just one project. Also, you can select a calculation mode: Actual to planned, Actual to baseline, or Planned to baseline.
Filtering data by projects and date ranges, with the ability to save filters, is available.
Additionally, you can export this table to Excel.
Budget analysis by project
With the help of this report, you will be able to track cost variance by each project to ensure that you stay on budget and avoid overspending.
You can include here one or several projects as well as portfolios. In addition, you can select a calculation mode depending on how many projects you have: for multiple projects – Actual to planned; for one project – Actual to baseline or Planned to baseline.
The following options are also available: grouping by projects and assignees, and filtering with the ability to save filters.
Additionally, you can export this table to Excel.
Budget S-Curve
With this report, you’ll be able to track your project’s cumulative budget and actual cost. In other words, it shows your planned budget, real spendings, and the deviation from the planned budget.
Only one project is available for inclusion here. Also, you can select a calculation mode: Actual to planned, Actual to baseline, or Planned to baseline.
Data filtering is available, including the option to save filters.
Additionally, you can export this table to Excel.
Time on tasks analysis by project
This report will help you track variance in working hours by each project. In other words, it shows the planned and spent time on tasks, as well as the variance between these values.
One and several projects as well as portfolios are available for inclusion here. Also, you can select a calculation mode depending on how many projects you have: for multiple projects – Actual to planned; for one project – Actual to baseline or Planned to baseline.
Data filtering is available, including the option to save filters.
Additionally, you can export this table to Excel.
Time on tasks S-Curve
With this report, you’ll be able to track project cumulative time logged and estimated hours.
You can include here just one project. Also, you can select a calculation mode: Actual to planned, Actual to baseline, or Planned to baseline.
Data filtering is available, including the option to save filters.
Additionally, you can export this table to Excel.
Time on tasks analysis by resource
This report will help you track variance in working hours by each resource. In other words, it shows the planned and spent time on tasks, as well as the variance between these values.
One and several projects as well as portfolios are available for inclusion here. Also, you can select a calculation mode depending on how many projects you have: for multiple projects – Actual to planned; for one project – Actual to baseline or Planned to baseline.
Data filtering is available, including the option to save filters.
Additionally, you can export this table to Excel.
Need help?
If you have questions about working with the new reports, contact us via the Live chat.