


Following the previous release with the updated task settings, we are glad to present another one.
From now on, in one place, you can track your project’s key indicators to make sure it goes the right way without risks.
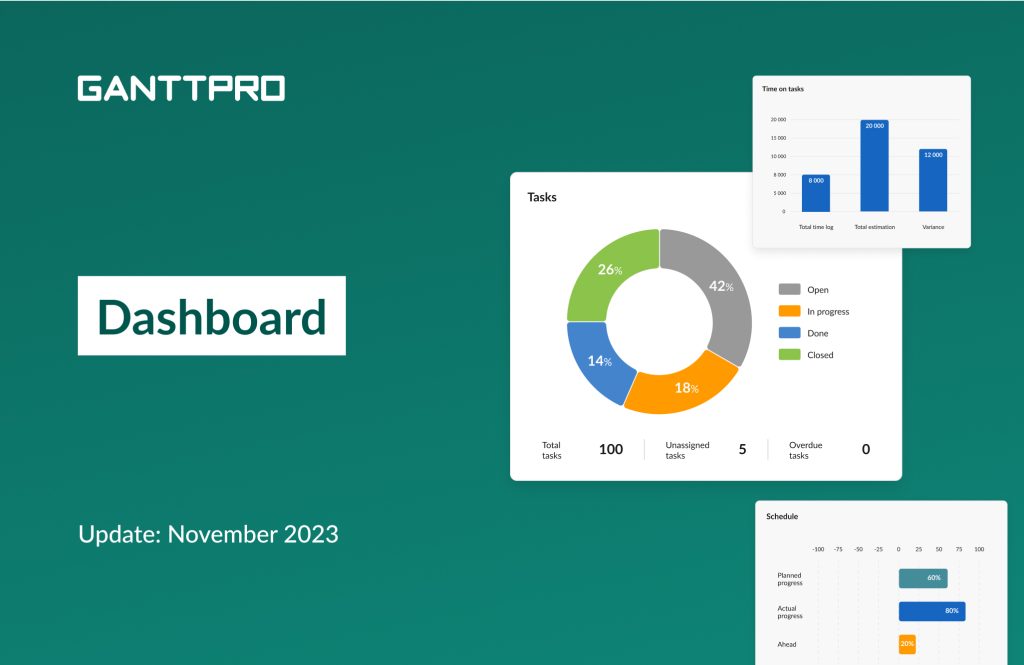
This is all about the Dashboard that shows how your project performs.
Let’s dive deeper into it.
What is the Dashboard?
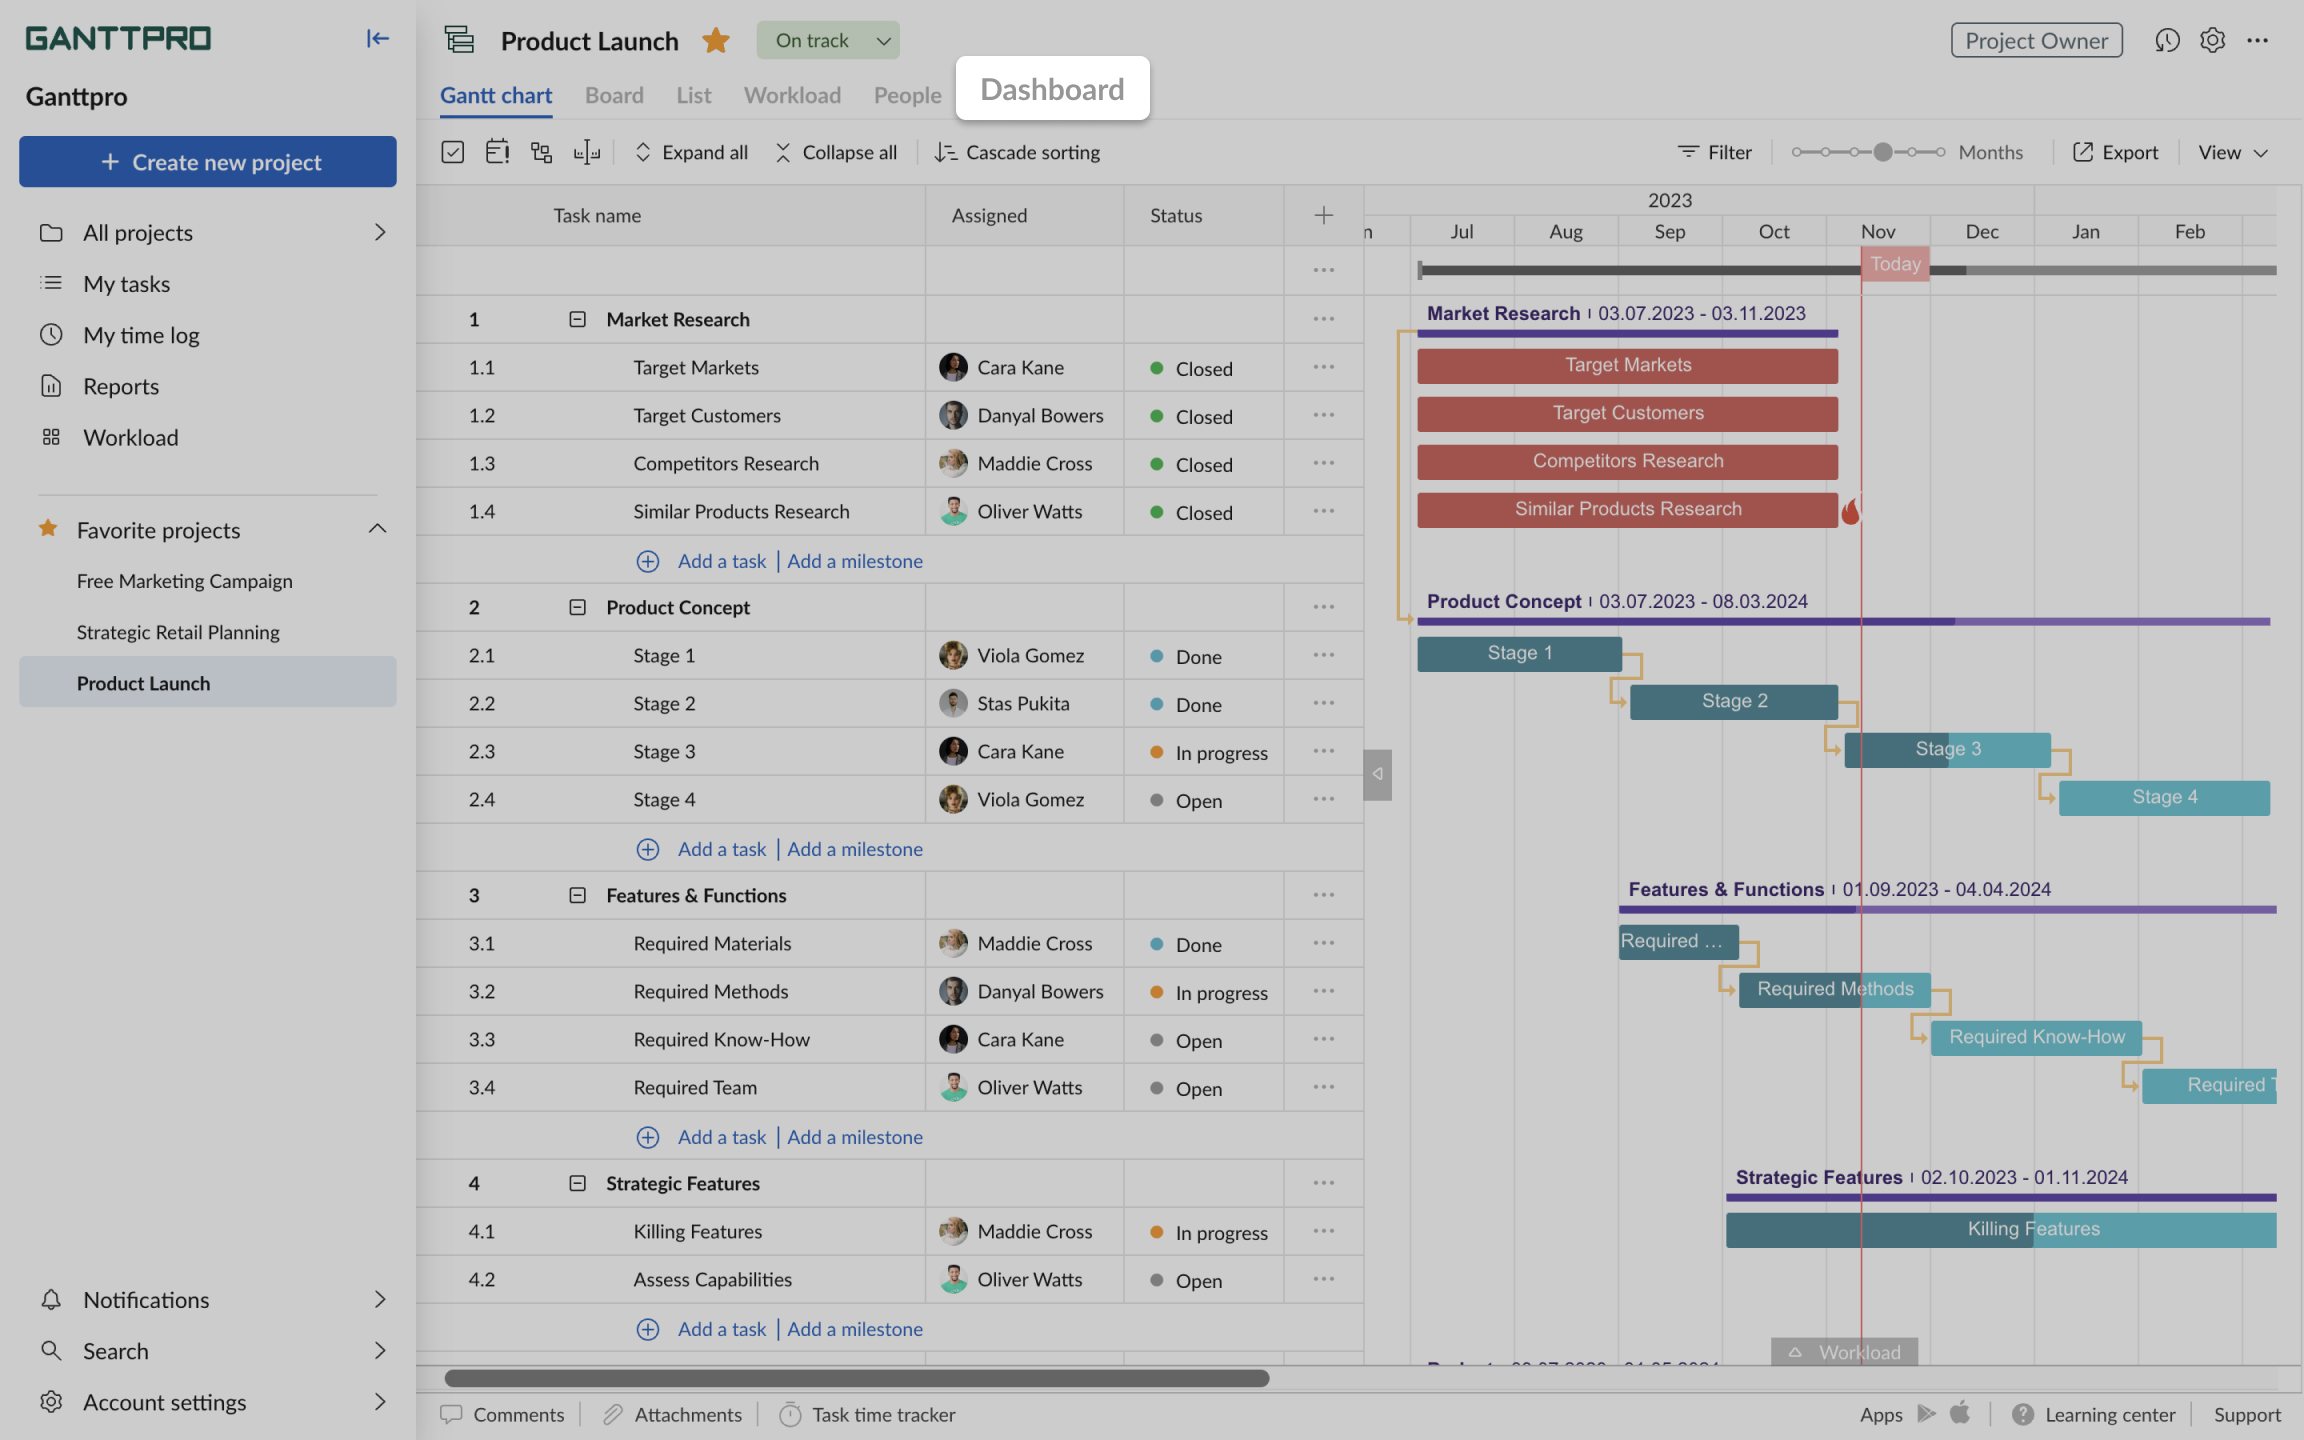
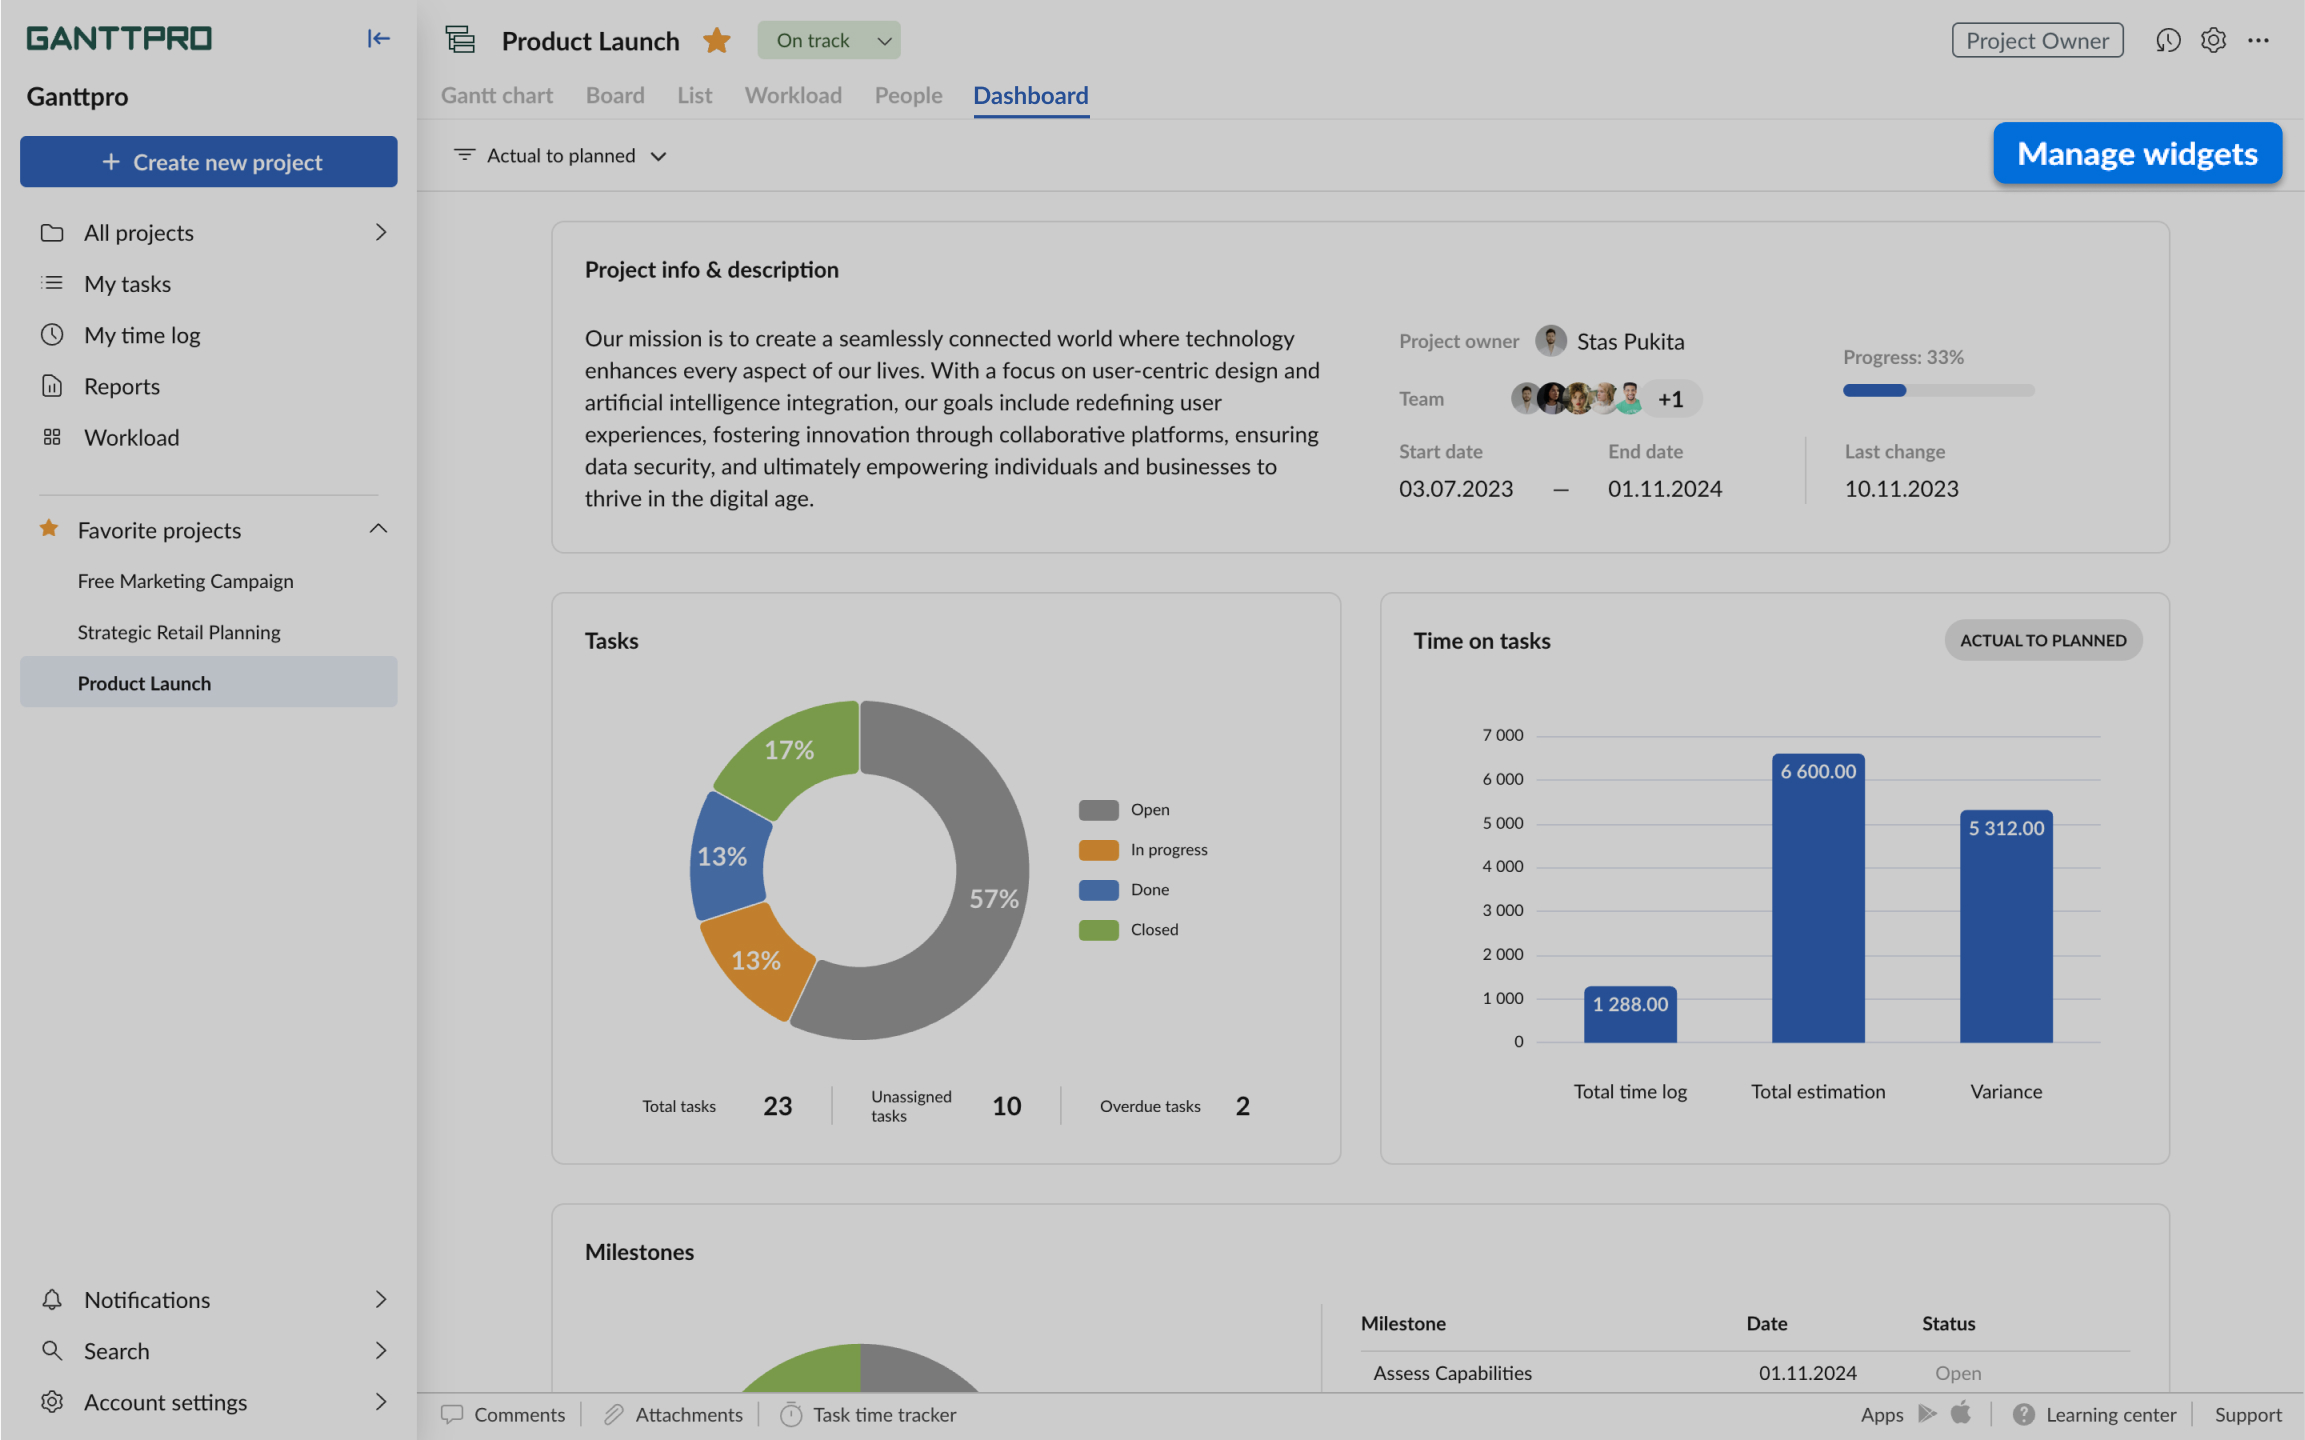
The Dashboard is a tab inside which you can track your project performance by its key indicators. You will find it at the top, right above the project grid.
How can you benefit from using it? Here are the main reasons to utilize it:
- Effective tracking of your project progress and status. At a glance, you will know where you are now and how much time and money you spend on tasks.
- Risk management. You will see potential risks at early stages.
- Time saving on progress reporting. It will take just a few seconds to make a report on your project status and show it to your team, stakeholders, or any other third party.
- Increased transparency. You will always have current and up-to-date information about your project at hand.
Now, let’s take a look at what you will find inside.
Dashboard: what’s inside
By default, the dashboard shows all 6 widgets:
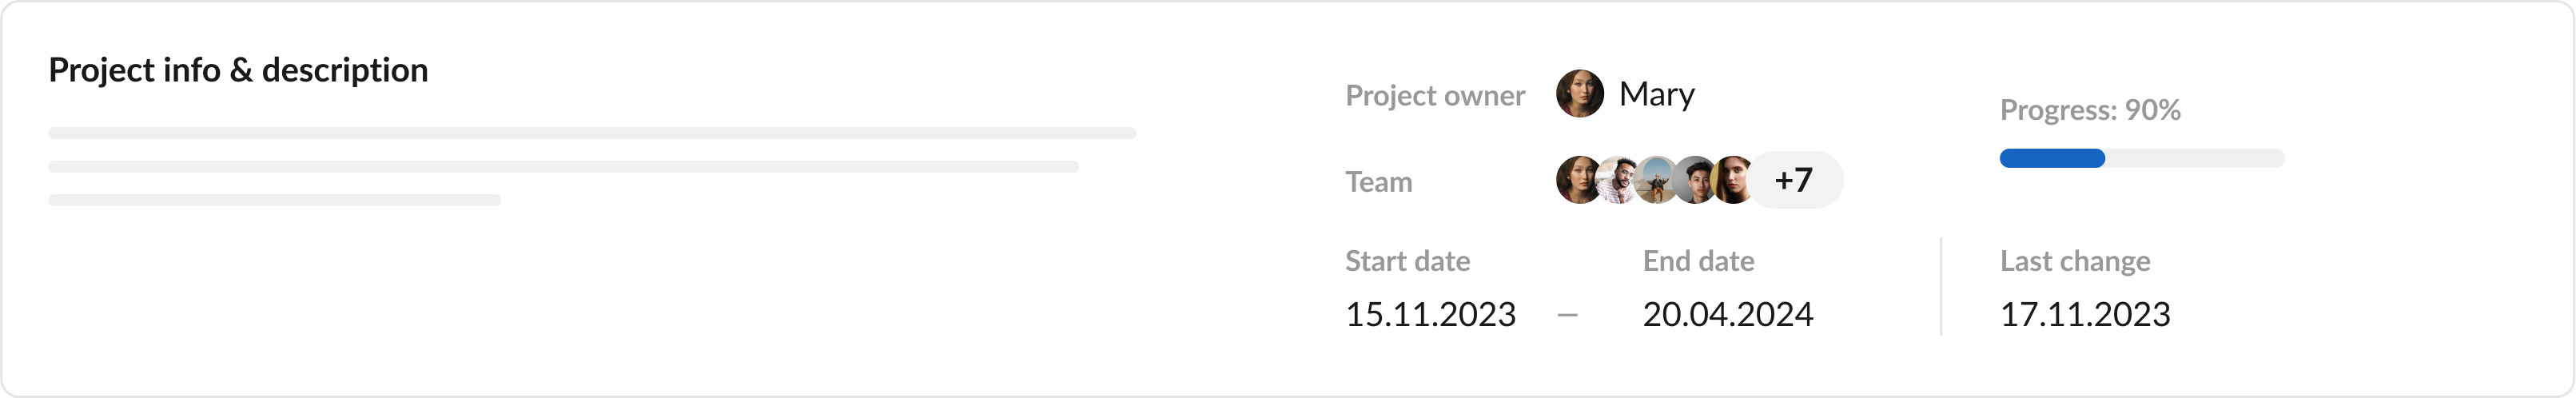
Project info & description
This is the first widget you’ll see. It shows key information about your project: its owner, team, start and end dates, progress, and last change.
Also, you can describe your project here and add any other relevant information.
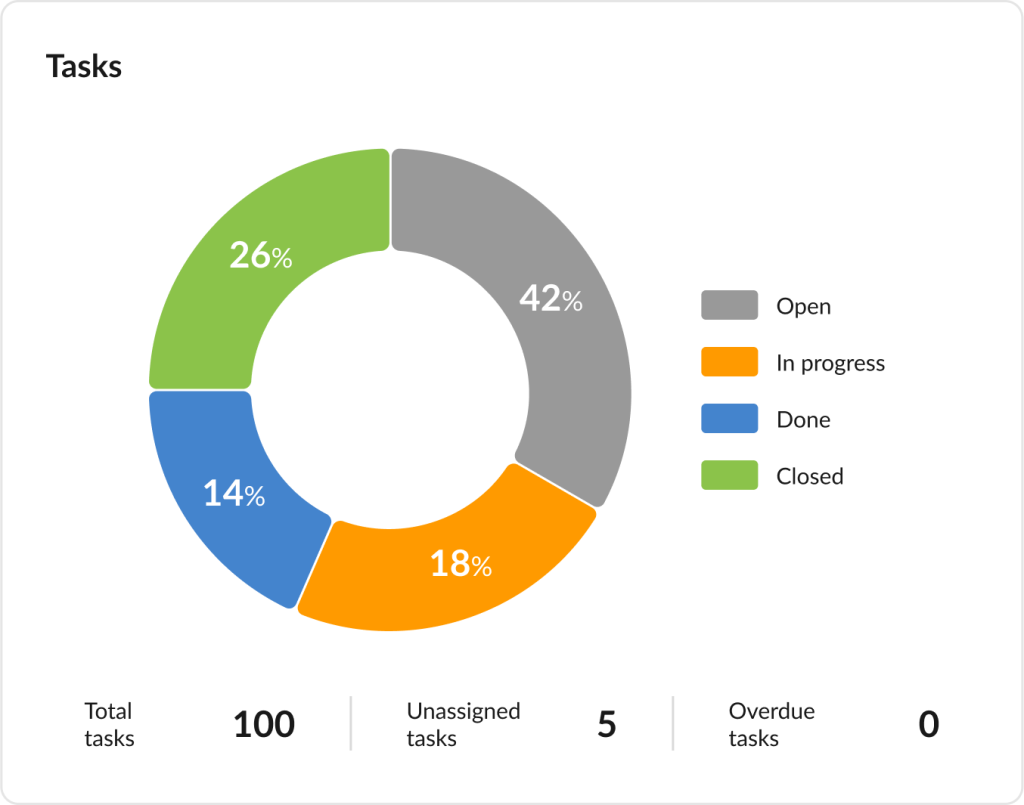
Tasks
The widget shows important information about your tasks on a color-coded pie chart.
You will see the statuses of your tasks as a percentage and how many of them are:
- Open.
- In progress.
- Done.
- Closed.
Different colors clearly differentiate the statuses so you can quickly get a common understanding of the current situation.
Moreover, you will also see the total number of tasks, how many of them are unassigned and overdue.

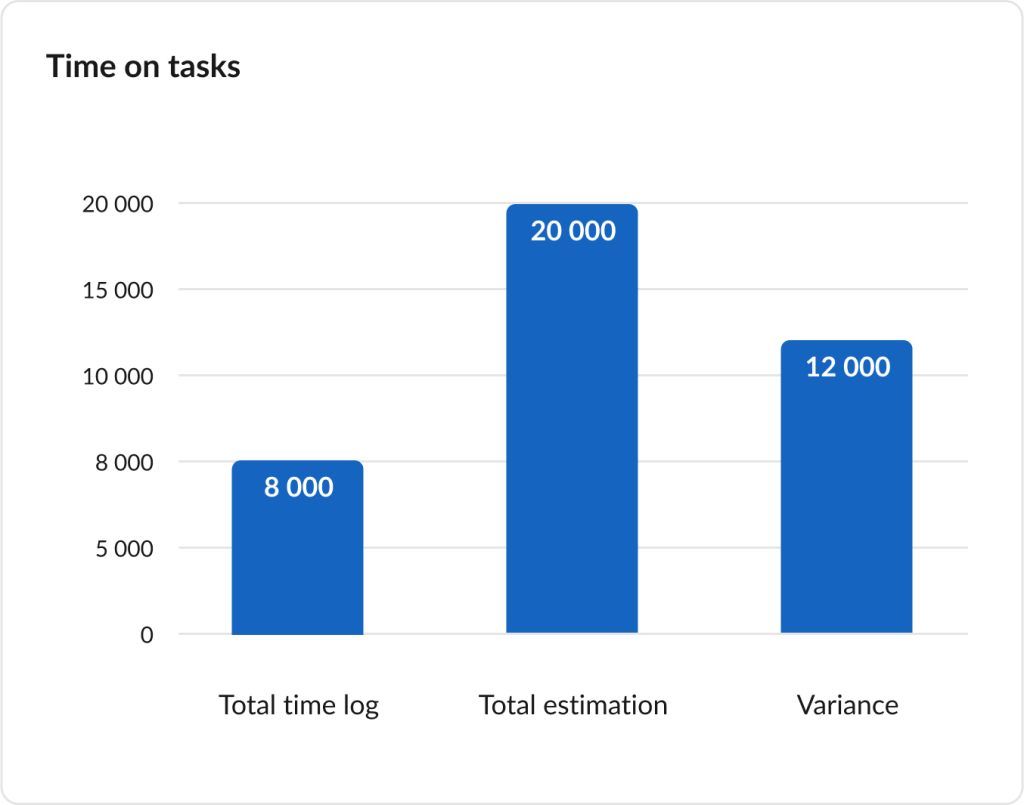
Time on tasks
With the help of a bar chart, you will see time spent on tasks. The graph shows:
- Total time log.
- Total estimation.
- Variance.
Thus, you will quickly realize the variance between the time logged on tasks and estimated values.
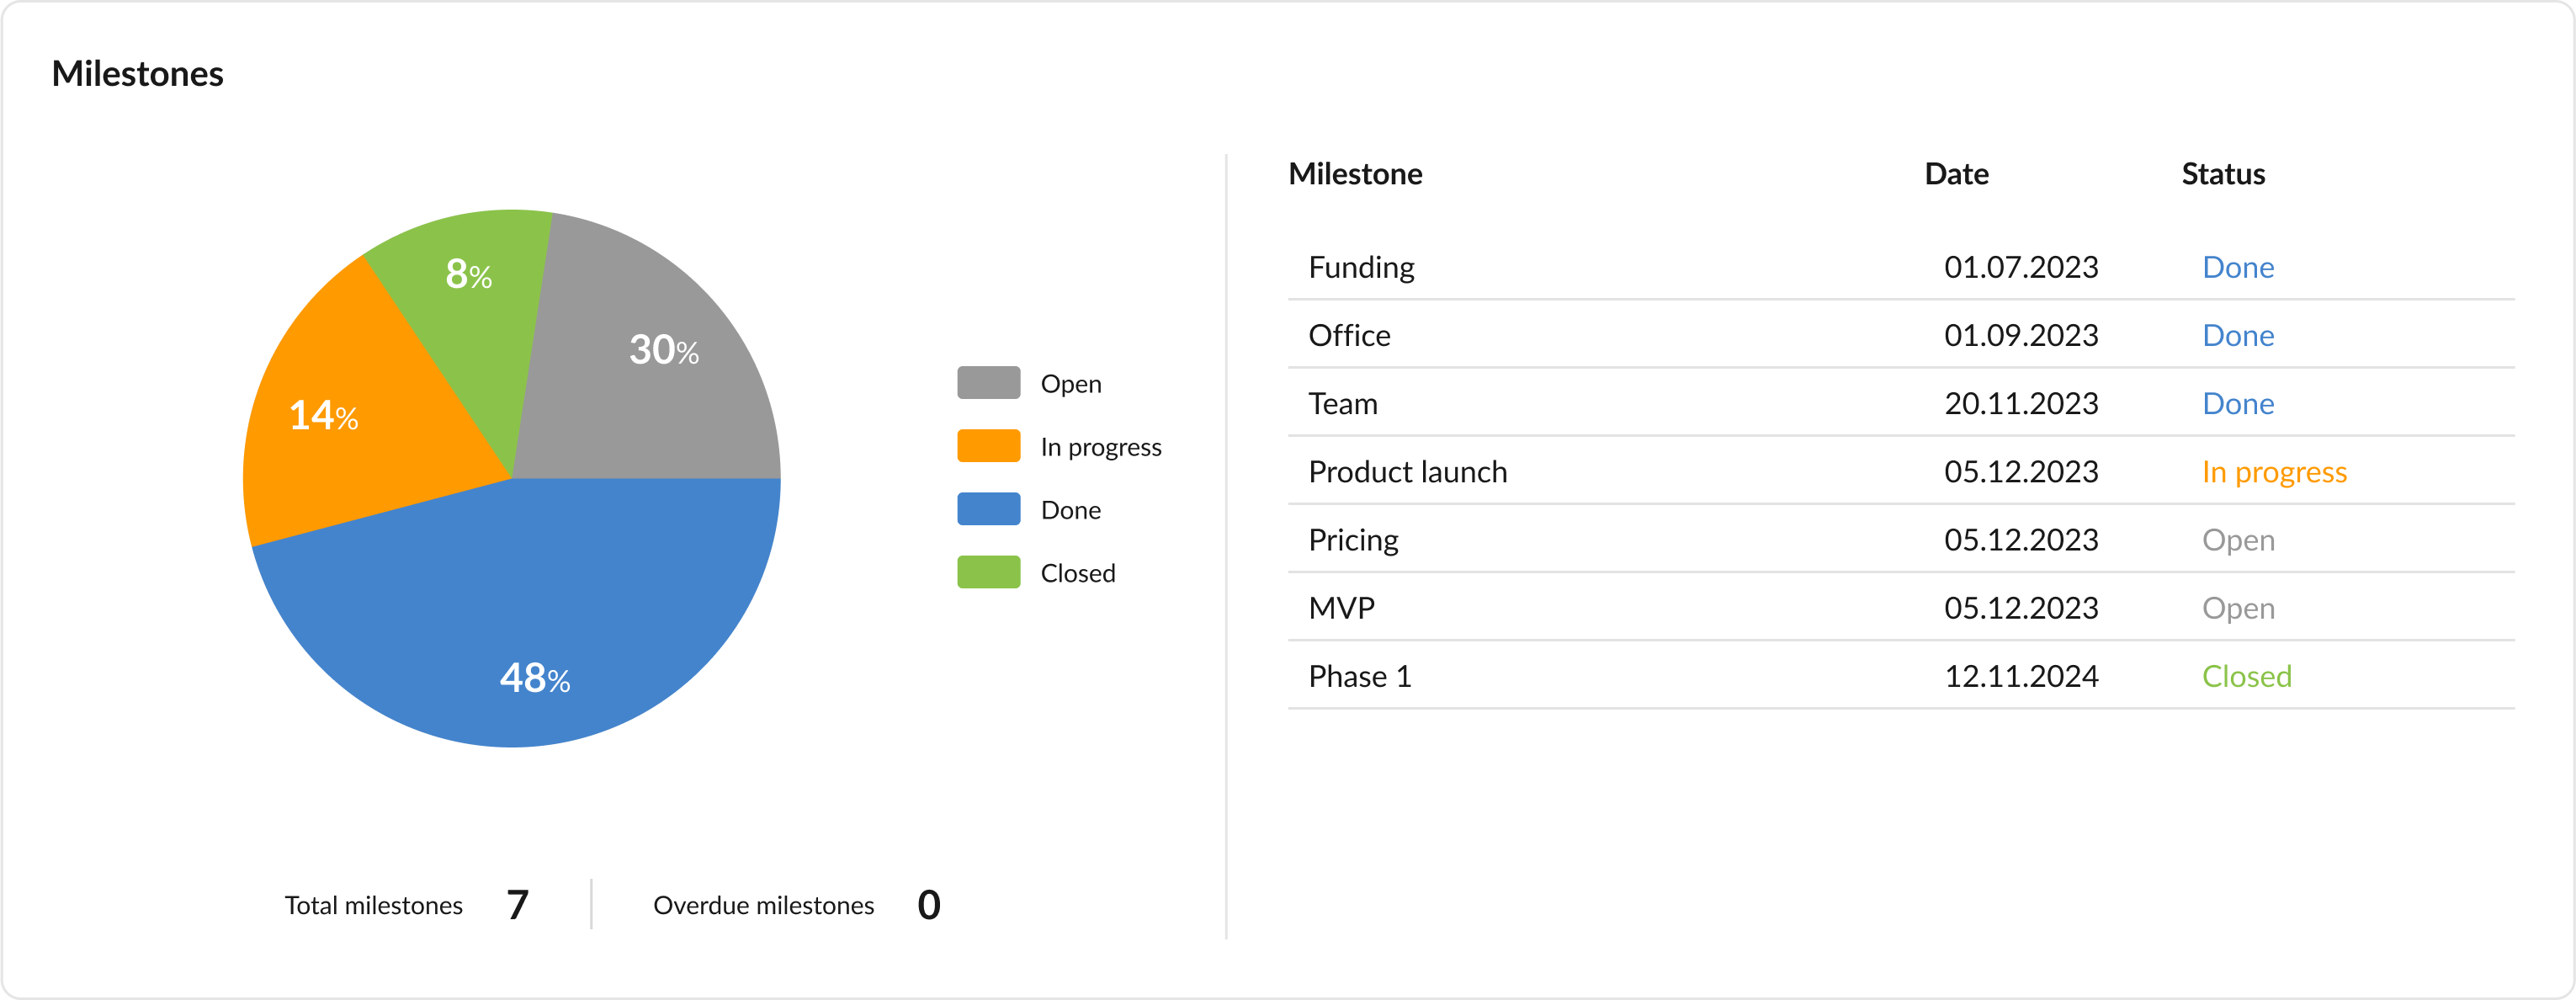
Milestones
This widget helps visualize project milestones on a color-coded pie chart.
You will see the statuses of your milestones as a percentage and how many of them are:
- Open.
- In progress.
- Done.
- Closed.
You will also see the total number of milestones and how many of them are overdue.
What is more, the widget contains a table that shows a name, date, and status for each milestone separately.
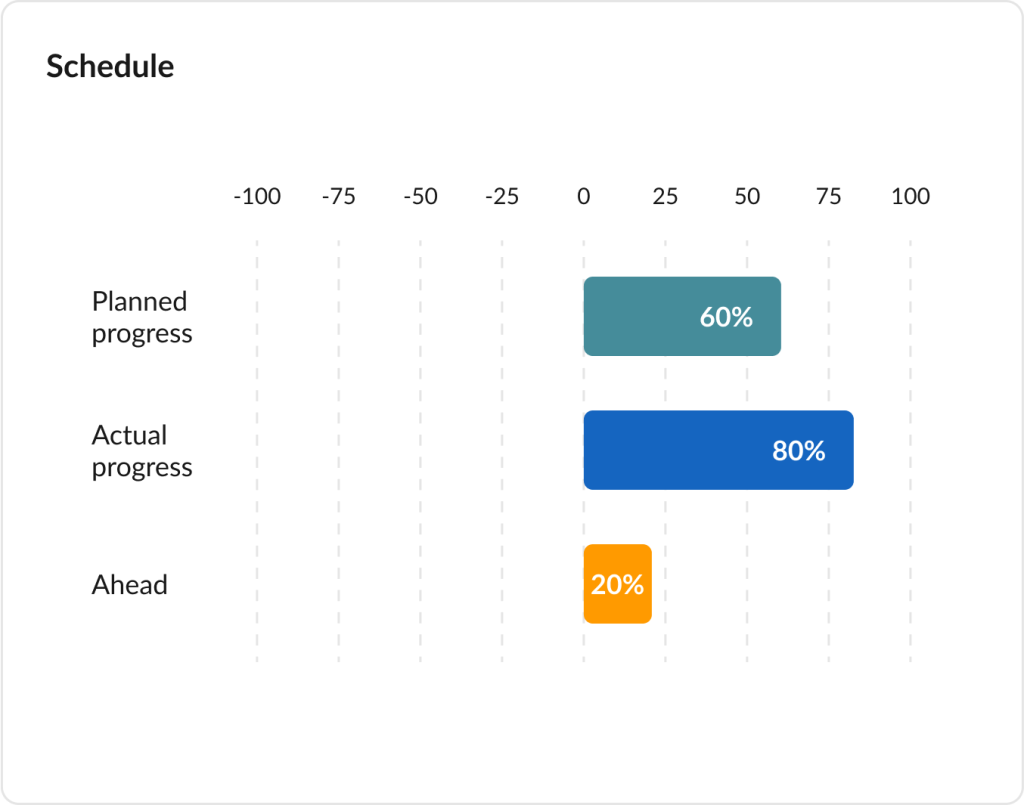
Schedule
With a horizontal bar chart, this widget helps you track the progress of your project. You can easily see whether it is on track or behind schedule.
In percentage, you will see:
- Planned progress.
- Actual progress.
- Variance between planned and actual progress.
A negative value means that your project is behind schedule.
A positive value means that your project is ahead of schedule.
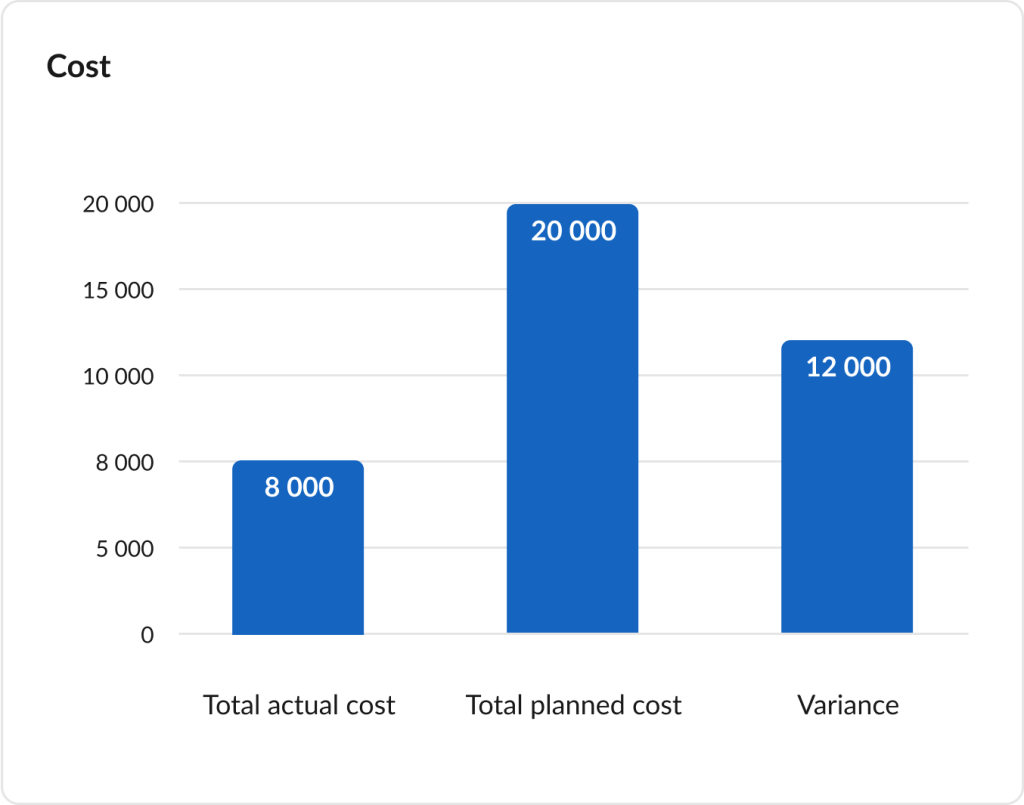
Cost
With a bar chart, the widget helps you track your project costs and ensure you stay within budget and avoid overspending.
The graph shows:
- Total actual cost.
- Total planned cost.
- Variance between actual and planned cost.
To calculate the variance, GanttPRO online Gantt chart generator takes the total actual cost as of the current date and the total planned cost of the entire project.
Note: by default, the dashboard shows all 6 widgets. However, you can customize it by selecting which ones you need to display.
For this, go to the upper right corner and click on the “Manage widgets” button.
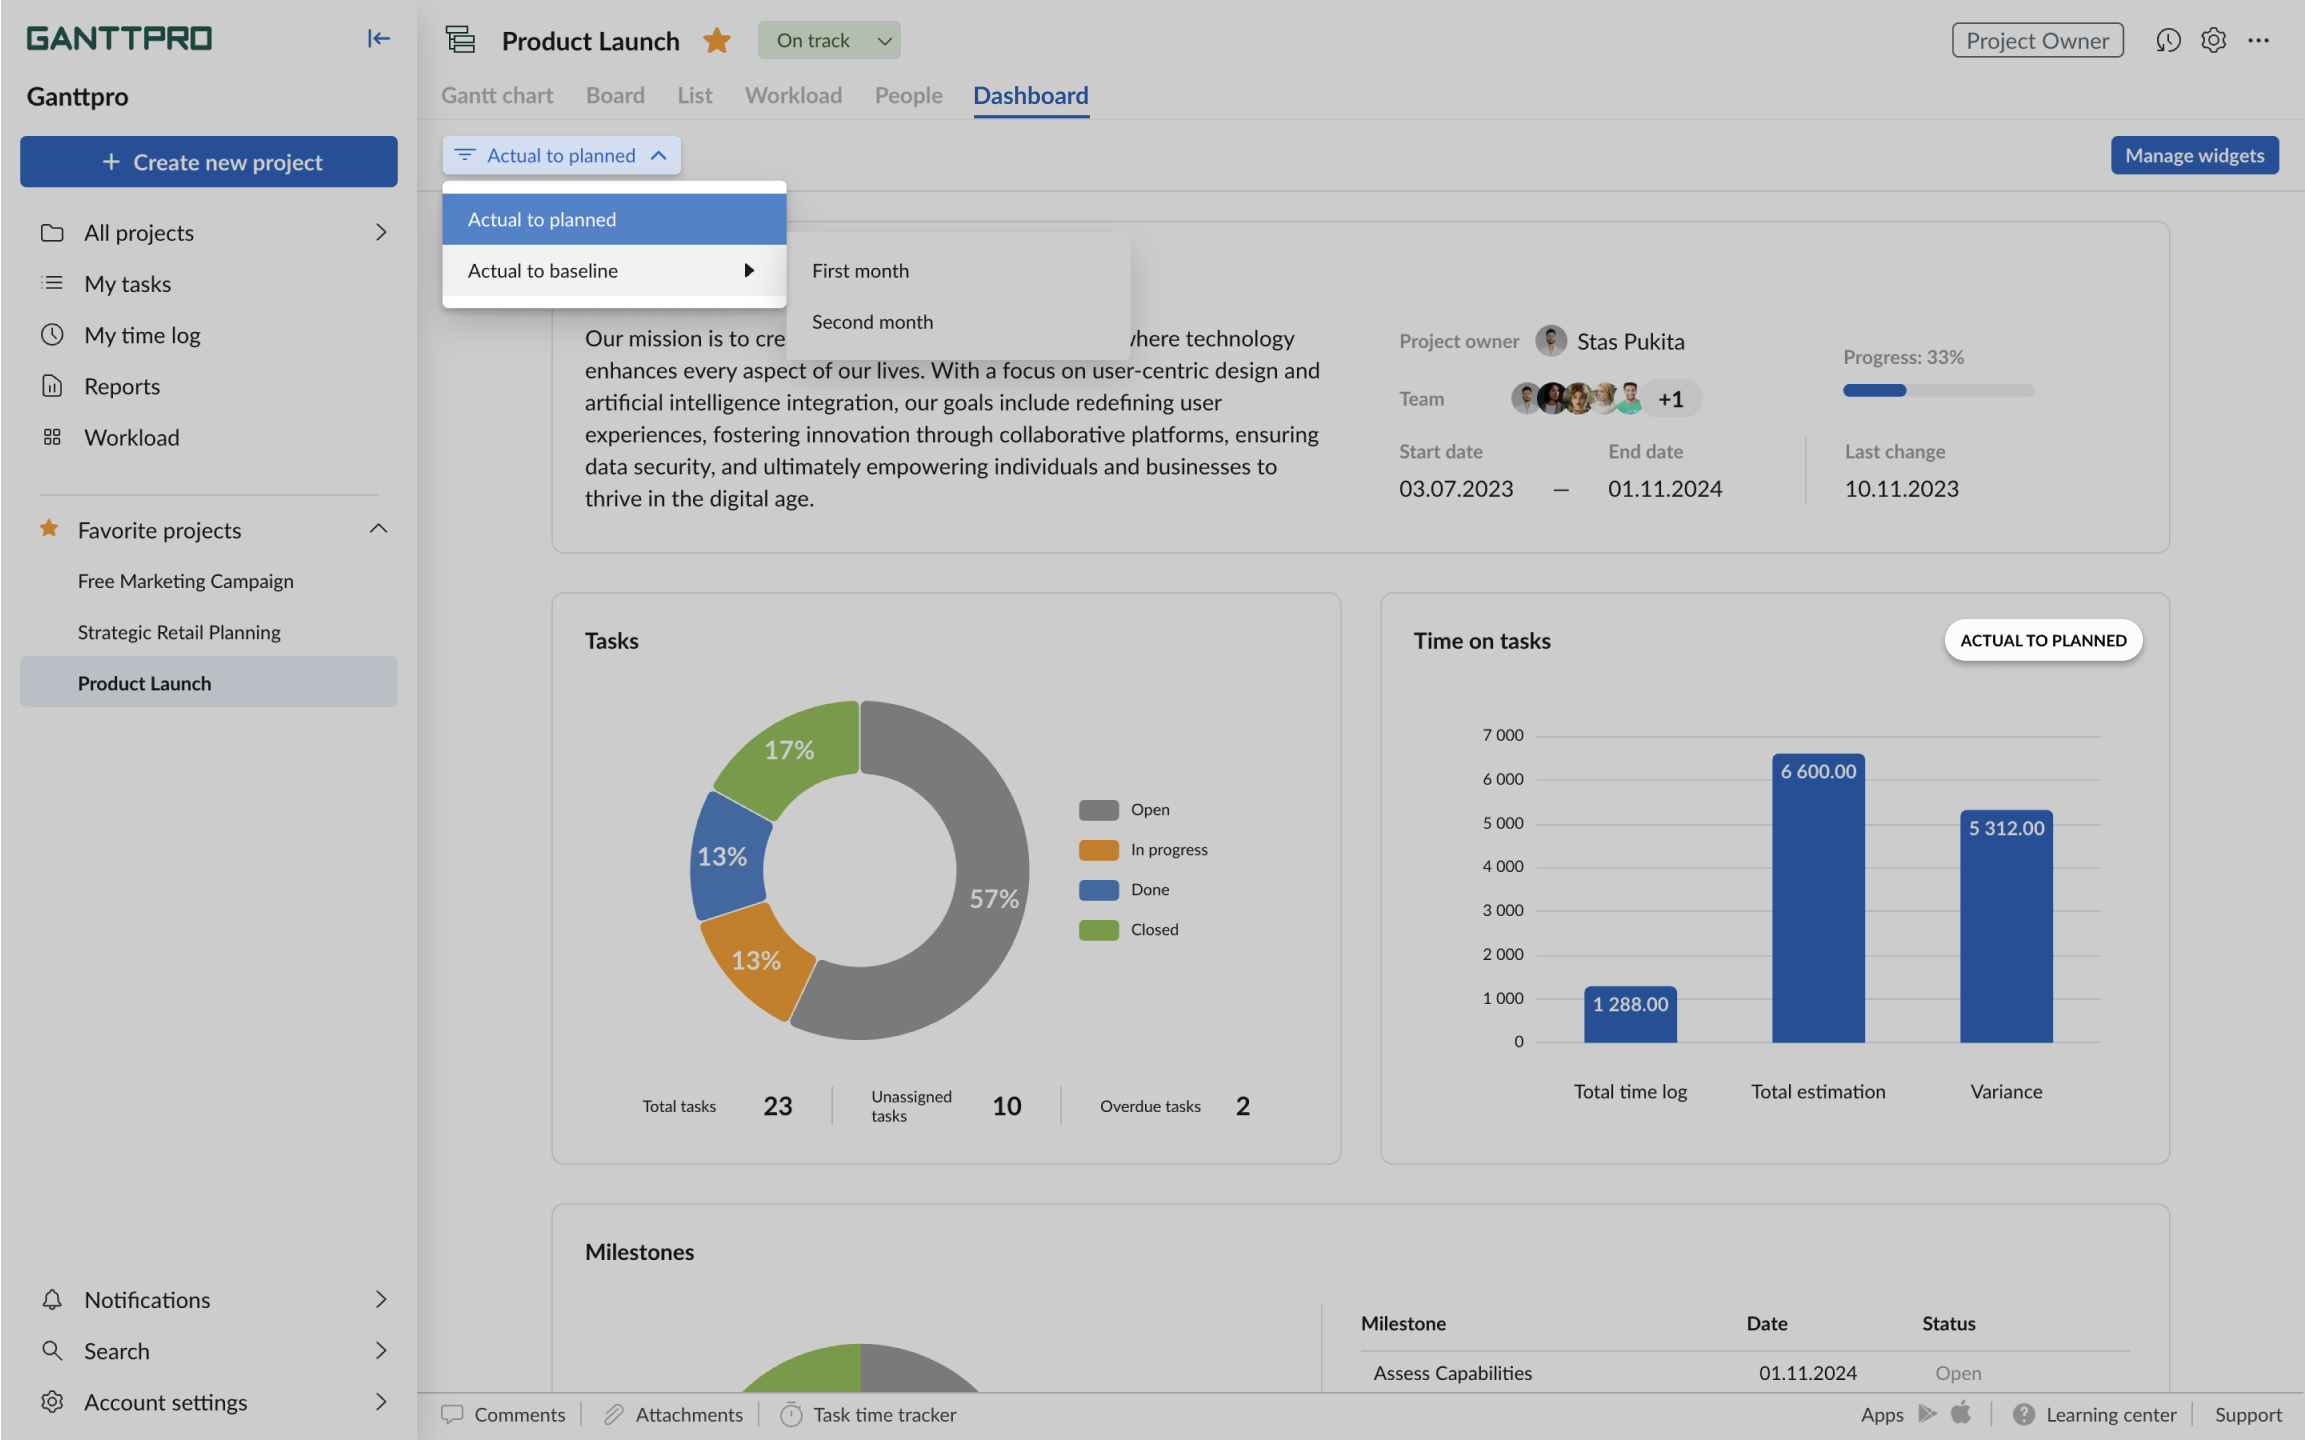
Actual to planned and Actual to baseline filters
For 3 widgets, namely, Time on tasks, Schedule, and Cost you can apply special filters – Actual to planned and Actual to baseline.
The Actual to planned mode compares current performance with initially estimated values.
The Actual to baseline mode compares current performance with the values saved as a baseline.
You will find the filter in the top left corner.
Need help?
If you have questions about how to work with the dashboard, ask us in the Live chat.