


There are a bunch of tools and techniques for planning and coordinating tasks and resources in project management. One such tool is a PERT chart.
What is a PERT chart? How does it simplify working with complicated plans? Let’s figure it out in this article.
At the end, you will also find a video overview.
What is a PERT chart?
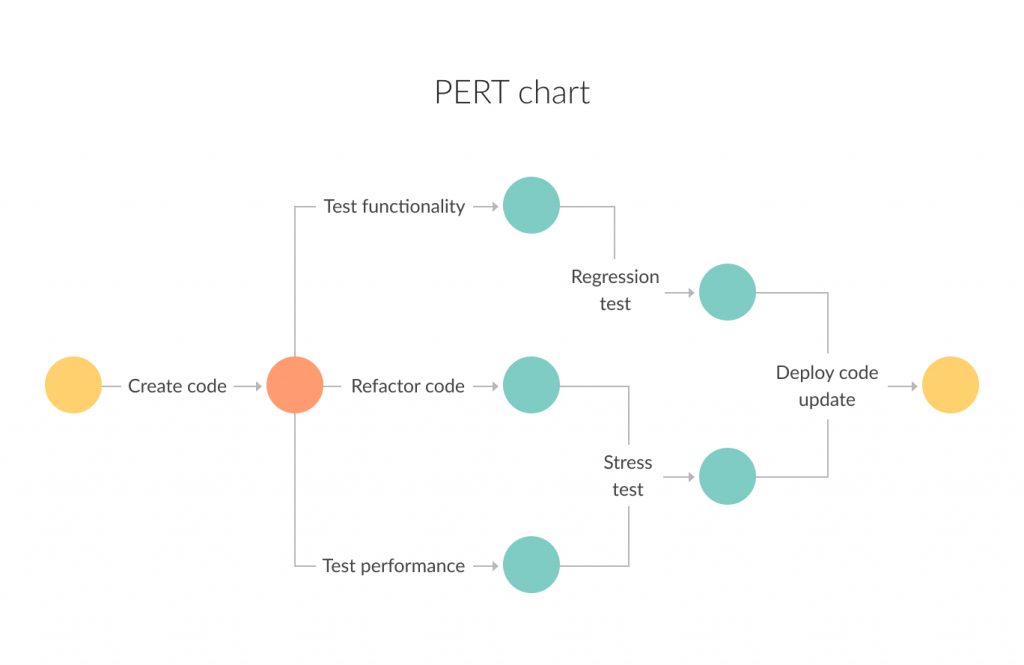
PERT stands for Project (or Program) Evaluation and Review Technique. PERT chart definition derives from this abbreviation: it is a PM tool that graphically represents a project’s tasks, terms, and dependencies between them.
A PERT chart looks like a network diagram. Every separate box (or nod) is a project task. All of them are connected with arrows that show dependencies between tasks.

It looks like a PERT chart is a kind of a project roadmap, doesn’t it? Actually, this is how Harold Kerzner, a famous American engineer and management consultant, describes it in his book “Project Management: A Systems Approach to Planning, Scheduling, and Controlling.”
“PERT chart can be easily considered as a roadmap for a particular program or project, where all the major elements (or events) have been completely identified, along with their corresponding inter-relations.”
What is a PERT chart used for?
The PERT charts have been used since the late ’50s of the previous century. They help to plan and determine tasks and set a realistic timeframe for project completion. In general, this project management tool aims to complete plans on time and accurately estimate the amount of work at the project planning stage.
Also, using this tool facilitates the process of finding a critical path. To make this, you need to compose the chain of tasks that takes the longest to complete the project.
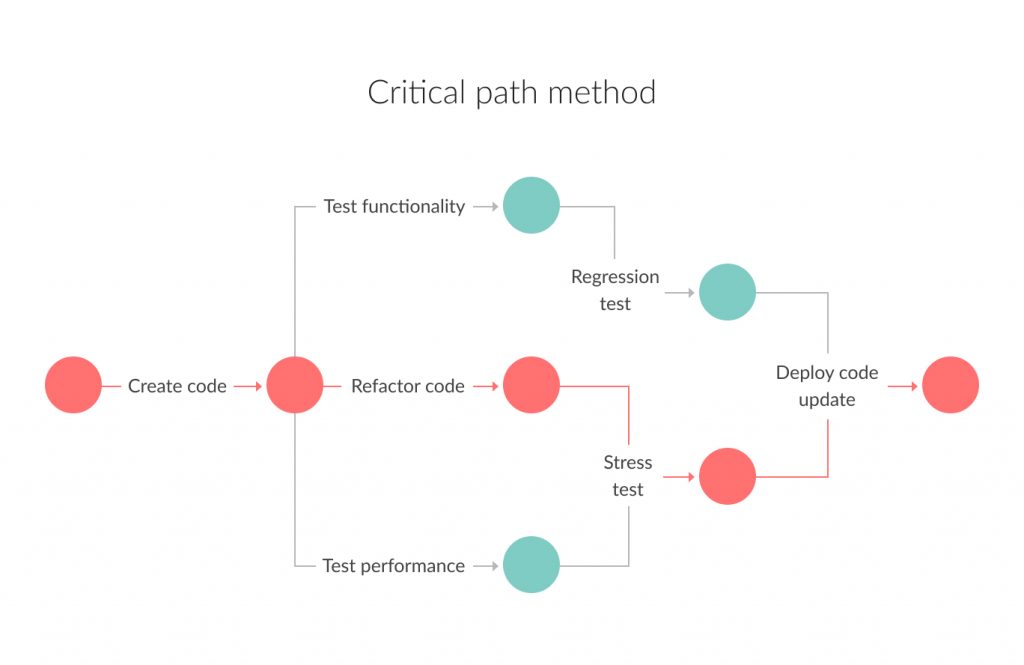
That is the critical path. If one of the tasks in this chain is finished with a delay, this will affect the entire project’s duration.
When project managers should use PERT charts
The PERT chart allows project managers to learn and track important information about the workflow: task dependencies, estimated task time, and minimum project delivery time. So, it suits mostly every project on a planning stage, except for the really small ones, where checklists are enough to see the big picture.
PERT chart will facilitate your workflow when:
- Your plan has multiple tasks in progress simultaneously. The diagram will ease the prioritization process, help you understand which task depends on another.
- A project has a strict time frame. As you already know, a PERT diagram is not only a visual representation of your project’s structure but also a helper to evaluate its duration. Using PERT charts allows you to set up terms and always stick to them, track which tasks completion affects the project realization on time.
How to draw a PERT chart
As we have mentioned before, a PERT chart is a free-form diagram that consists of nodes (events or milestones) and arrows (tasks).
Steps to create a PERT diagram:
- Map the project’s main phases, milestones, and tasks.
- If some activities have dependencies, connect them with directional arrows. It will ensure your team knows the project implementation chronology. If some actions need to be performed at the same time, connect them with diverging arrows.
- Take the main phases and milestones in numbered boxes and picture them. Then write out the tasks that your team has to accomplish between every box, using directional or divergent arrows.
- Finally, establish a timeframe for every activity.
You have your PERT chart done. Now it is much easier to track the project’s every stage, control tasks implementation and durations, and be sure all tasks are performed in the correct order.
What is a Gantt chart?
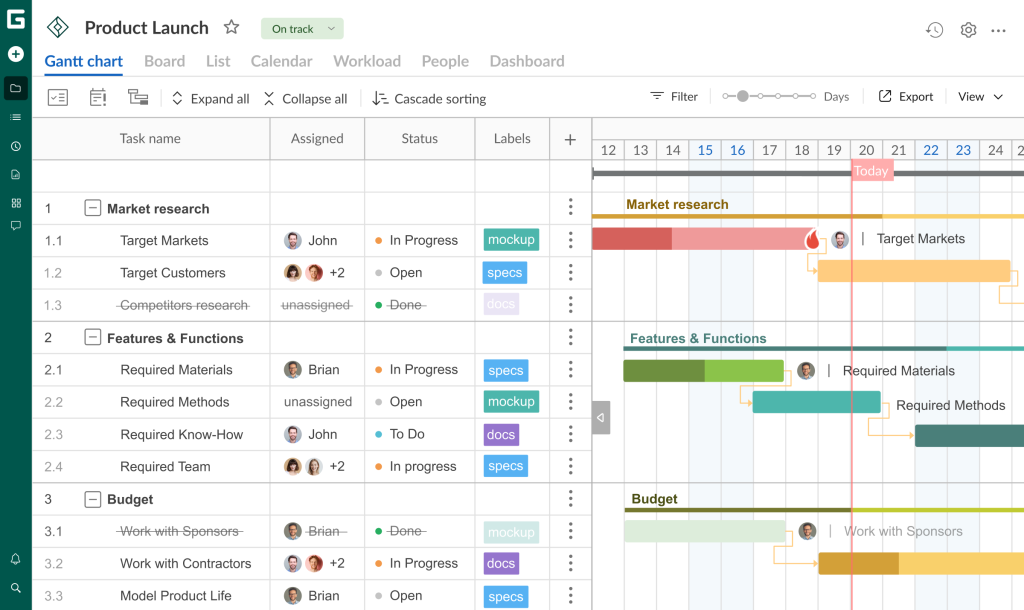
And what is a Gantt chart? It is also a project management tool for workflow visualization. The diagram consists of two axes:
- A vertical one. It represents a list of tasks that your team has to complete to get a project done.
- A horizontal axis is a plan’s timeline, where bars with tasks are situated in chronological order.

What is a Gantt chart used for?
Gantt charts are used for a robust project management process. The diagram helps:
- Manage tasks and milestones.
- Manage start/end dates.
- Increase team productivity.
- Make the workflow more transparent.
- Control workload.
- Not to forget about deadlines.
- Track the progress of every task and the project at all.
- Assess risks and eliminate them on time.
When project managers should use Gantt charts
Project managers use Gantt charts to see the big picture of the project, create and assign tasks, run budgets, manage resources, and many more. With the diagram, you can be sure that everyone’s on track and has constant access to the project’s schedule and details.
In other words, Gantt charts help PMs track every step of a project’s implementation to achieve the best results.
How to create a Gantt chart
For creating a Gantt chart manually, you will need only a pen, a notebook, and a clear vision of the plan.
Start from a vertical axis: list all the tasks needed to complete the project successfully. Compose them in chronological order. Then, horizontally, write down dates and situate every task according to its realization timeframe.
It is important to mention that this way of planning suits small to medium projects. The bigger your project is, the harder it is to draw it on paper. Especially if changes or corrections are foreseen, it is rather tedious to make them manually.
To avoid this problem, you can try out a specially designed tool for creating Gantt charts. Online Gantt chart software facilitates work with diagrams, makes it easier to build, change, and manage them.

Online software for creating and working with Gantt charts
Manage multiple projects at once, allocate resources, and collaborate with your team.
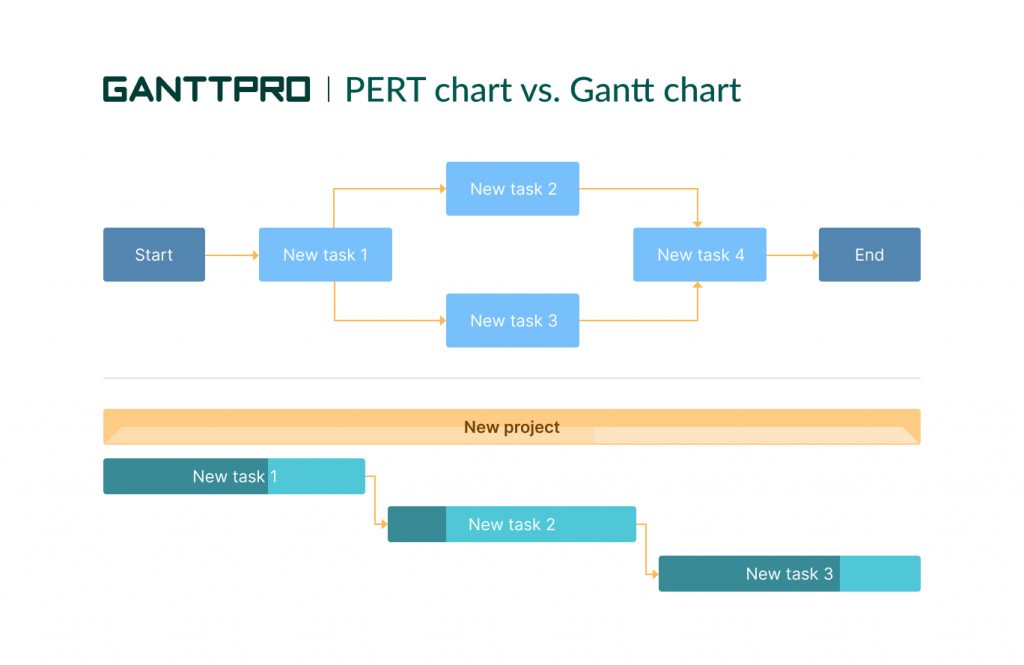
Sign up for freePERT chart vs. Gantt chart: which one will suit my project?
Both of these project management charts represent steps of project implementation, its tasks, and timeframes. So, which diagram is right precisely for your project?
Let’s focus on the main differences between PERT and Gantt diagrams to understand better when to apply them.
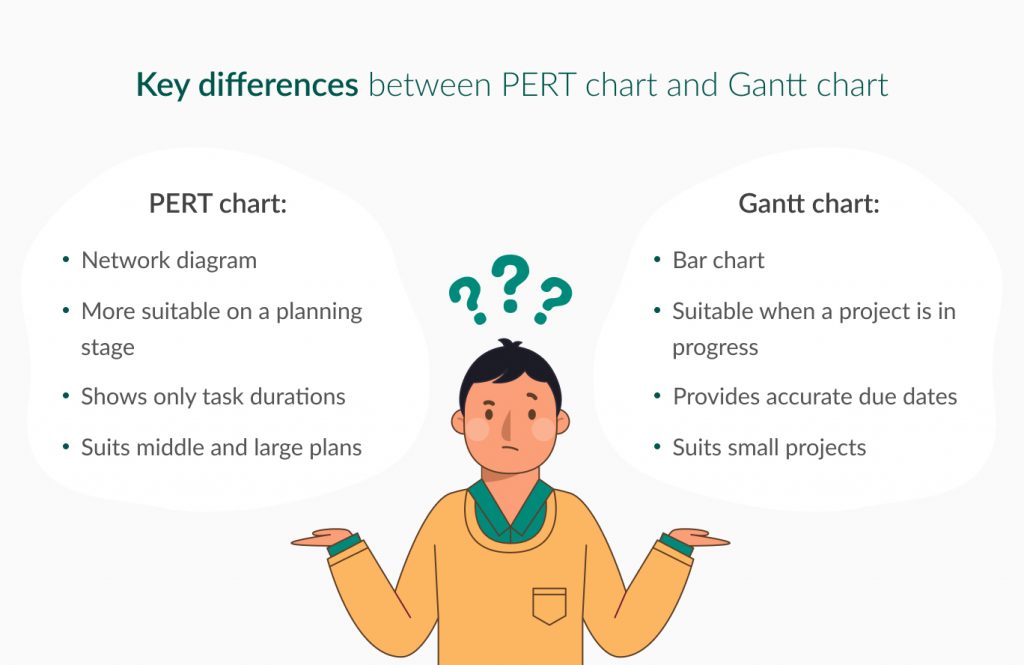
Key differences between PERT chart and Gantt chart
As you could see, the main difference between PERT and Gantt charts is the way of information visualization. PERT is a free-form diagram, while Gantt charts are bar graphs.
A PERT chart helps think out how long your project will take and identify dependencies between plan tasks. A Gantt chart is essential for spotting project bottlenecks to make operational corrections and not deviate from the set plan. In other words, PERT charts will suit you more on a project planning stage; Gantt charts are used when a project is actually going.
A Gantt chart focuses on the specific dates to complete a task, and the deadline is necessary for every task. Instead, a PERT chart focuses on the dependencies between tasks and doesn’t require an exact task start and end dates.
Last but not least. Gantt charts are usually used for small projects. That is why they are more straightforward and simple. PERT charts can suit complex mid-sized and large projects, so they could be sometimes complicated but can be used for finding a critical path.
Use Gantt charts and PERT diagrams for efficient project management
Both Gantt and PERT diagrams can simplify working with projects, increase productivity, and make the workflow more transparent for everyone.
Now, when you know everything about these tools, you can decide what to use: a PERT chart for project planning or a Gantt chart to track and manage its progress. By the way, think of implementing both project management diagrams. It can boost efficiencies on every project stage.
Here is a video that highlights all key points.
